Currency Hedging in International ETFs: 5-Year Performance, Volatility

Currency Hedging in International ETFs: 5-Year Performance, Volatility

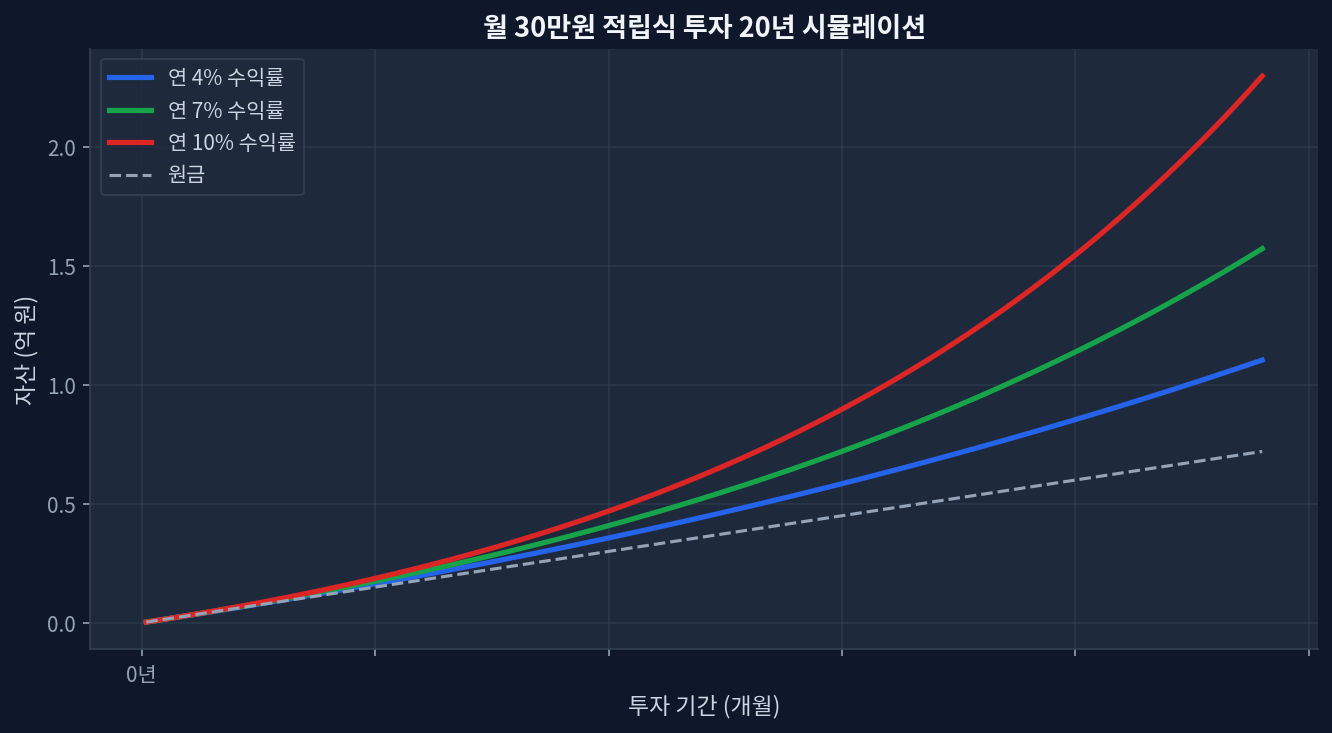
Core TakeawaysHedging Effect: During periods of US dollar strength, currency-hedged ETFs protect returns; during dollar weakness, they sacrifice gains — 2021–2023 USD strength favored unhedged international positionsVolatility Reduction: Hedged international ETFs typically exhibit 15–20% lower volatility than unhedged peers, eliminating currency fluctuation noiseCost Friction: Annual hedging premium ranges 0.5–1.5% — a material drag on low-dividend indicesTax Efficiency: US tax treatment of hedged positions differs; foreign tax credits and wash-sale rules require individual reviewTime Horizon Rule: Unhedged favored for 5+ year holds; hedged worth evaluating for 2-year or shorter positions, or when volatility tolerance is low What Currency Hedging Does: Mechanics and Real Cost Monthly $30K investment 20-year compound growth simulation VXUS vs QQQ core metrics comparison" loading="lazy" style="max-width:100%;border-radius:8px;">VOO vs VXUS vs QQQ: Risk and Return Across Markets When a US investor purchases international equity ETFs, two distinct sources of return emerge: equity price movement in the foreign market, and currency fluctuation relative to the US dollar. Currency-hedged ETFs attempt to neutralize the second component using forward contracts or options, locking in the exchange rate at purchase. ...
June 16, 2026 · InvestIQs Research
VTI vs VXUS: 15-Year Return Data and the Tax Placement Gap Most Portfolios Ignore

VTI vs VXUS: 15-Year Return Data and the Tax Placement Gap Most Portfolios Ignore

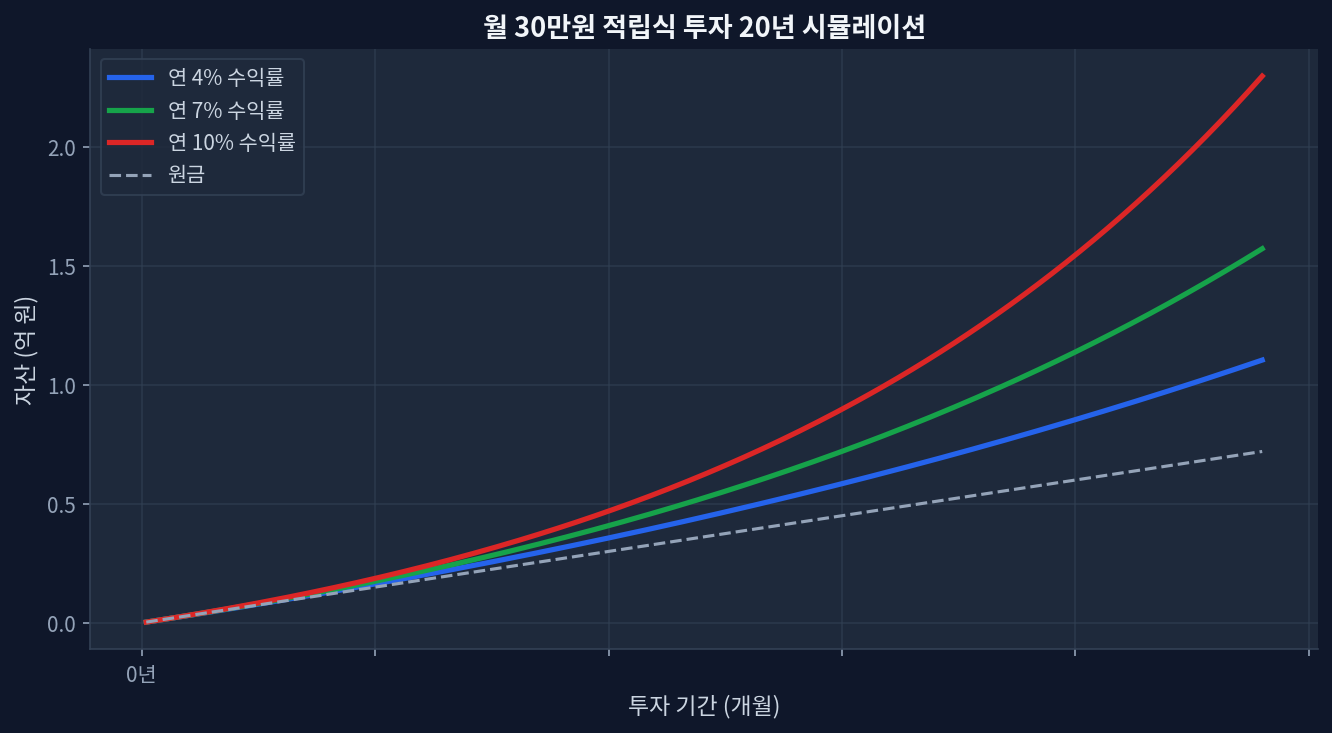
VTI 5Y return: +78.9% vs VXUS +51.1% — but VXUS leads on 1Y at +33.5% vs VTI +27.6%, a reversal worth interrogating.VXUS yields 2.69% vs VTI 1.03% — 2.6x higher income generates greater annual tax drag in taxable accounts.Valuation gap: VTI P/E 28.5 vs VXUS 18.7 — a 52% US premium, historically wide by post-2000 standards.Foreign tax credit from VXUS dividends is recoverable only in taxable brokerage accounts; permanently forfeited inside Roth IRA or 401(k).AUM: VTI $2,202.6B vs VXUS $629.1B — scale gap reflects US home bias more than quality difference. The Performance Split — And the 1-Year Flip That Challenges the Narrative Monthly $30K investment 20-year compound growth simulation The 20-year DCA simulation chart above — modeling $1,500 monthly at 4%, 7%, and 10% annual returns — illustrates how the VTI/VXUS allocation decision quietly reshapes terminal wealth over decades. The multi-year data gives VTI the unambiguous edge. Five-year cumulative: +78.9% vs VXUS’s +51.1%. Three-year: +86.1% vs +66.7%. That 20-30 percentage point spread is not noise — it compounds into a materially different retirement outcome.[Yahoo Finance] ...

May 14, 2026 · InvestIQs Research