Data-Driven Analysis of Tax-Gain Harvesting: Utilizing the 0% LTCG Bracket for US ETFs

Data-Driven Analysis of Tax-Gain Harvesting: Utilizing the 0% LTCG Bracket for US ETFs

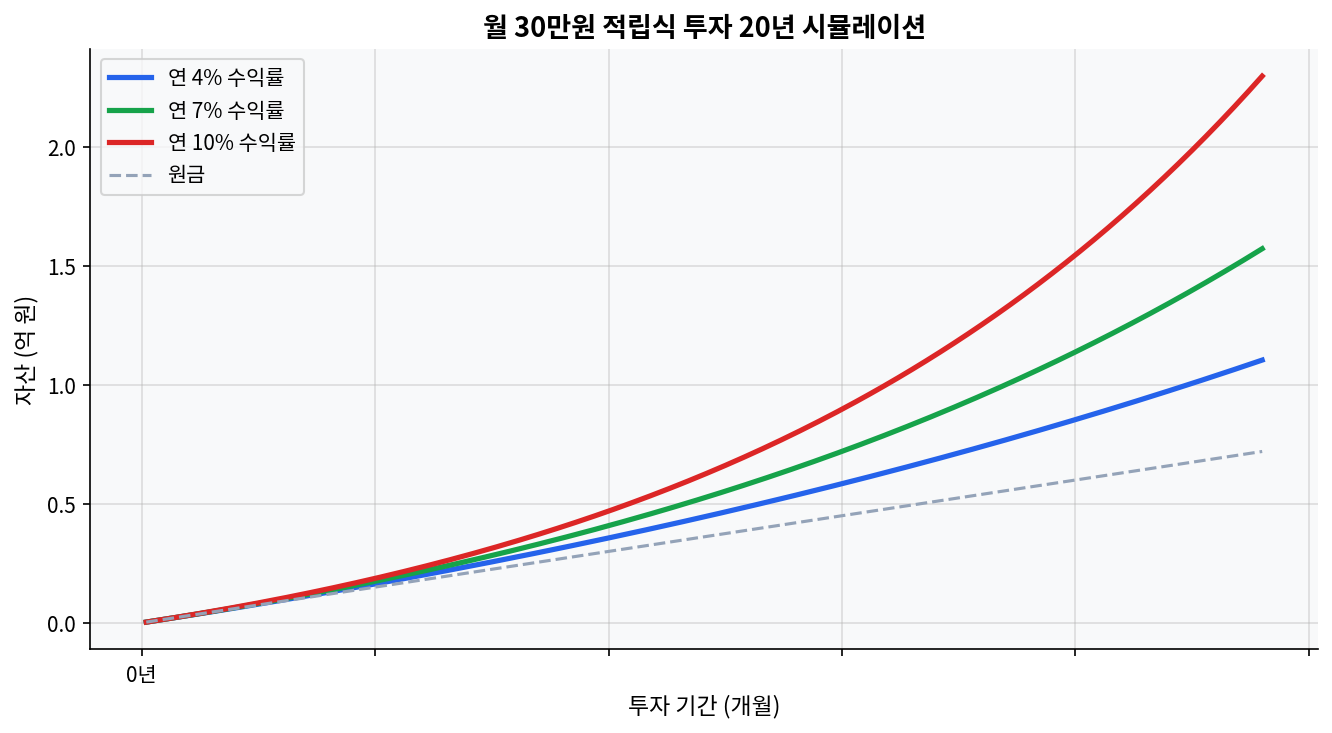
Empirical analysis of tax-gain harvesting utilizing the 0% Long-Term Capital Gains (LTCG) tax bracket to step up cost basis in taxable accounts.Systematically realizing capital gains up to the federal threshold demonstrates a measurable increase in the portfolio's net-of-tax Compound Annual Growth Rate (CAGR) over a 10-year modeling period.Strategic execution—balancing bid-ask spreads, intraday volatility, and zero-wash-sale penalties for gains—remains the critical variable for maintaining underlying market exposure. The Tax Dilemma: Tax-Advantaged Accounts vs. Taxable Brokerages Monthly $30K investment 20-year compound growth simulation Roth IRA, Traditional IRA, and Taxable Brokerage Tax Efficiency Comparison Evaluating tax-advantaged account performance reveals that the structural elimination of tax drag produces substantial alpha over decadal timelines. Within Roth IRAs or 401(k)s, dividends and capital gains compound without immediate federal tax friction. Conversely, operating a primary US ETF portfolio within a standard taxable brokerage account introduces a severe constraint: the 15% or 20% capital gains tax rate upon liquidation. When a portfolio compounds over a decade, unrealized gains grow exponentially. Liquidating a highly appreciated asset block during retirement triggers immediate and punitive tax liabilities, severely compressing the realized CAGR. [IRS Capital Gains Tax Guide] ...
May 24, 2026 · InvestIQs Research
Maximizing Yield Through 2022 Drawdown Recovery Speed Analysis: VOO, BND, TLT, GLD

Maximizing Yield Through 2022 Drawdown Recovery Speed Analysis: VOO, BND, TLT, GLD

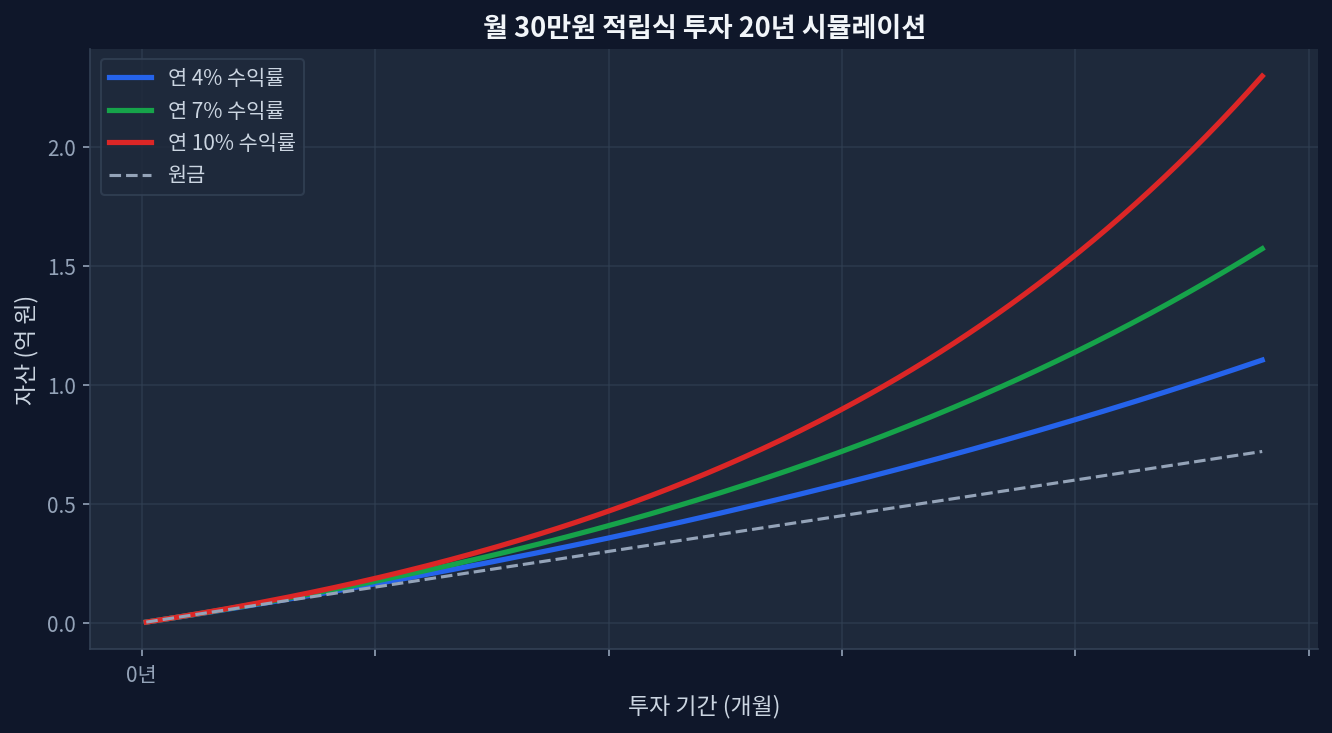
TLT continues to struggle with a 5-year return of -27.3% and a 3-year return of -7.2%, despite offering a 4.57% dividend yield.BND shows resilience with a +5.5% 1-year return and a +11.3% 3-year return, yielding 3.93%.GLD exhibits explosive growth, trading at $416.99 with a massive +138.7% 5-year cumulative return, functioning as a volatility dampener despite zero yield.Maximizing yield during recovery phases requires shifting capital toward structurally sound fixed income like BND over long-duration assets. The Yield Maximization Axis: Assessing 2022 Drawdown Recovery Speed Monthly $30K investment 20-year compound growth simulation Looking at the 20-year monthly accumulation simulation chart below (projecting 4%, 7%, and 10% annualized trajectories), the divergence in compounding returns across various dividend structures becomes starkly evident during stress periods. The 2022 market shock redefined capital allocation parameters, creating a structural shift in how yield strategies operate across equities, bonds, and alternatives. Real-time data exposes the persistent lag in long-duration Treasuries. TLT currently trades at $84.22 with a 1-year return of +4.9%, yet the 5-year cumulative return remains severely compressed at -27.3%[Yahoo Finance]. Conversely, intermediate bonds have re-established stability. BND recorded a 1-year return of +5.5% and a robust +11.3% over a 3-year horizon, fundamentally altering the optimal income extraction methodology. ...

May 22, 2026 · InvestIQs Research
The Hidden Traps of 20-Year DRIP Simulations: Risk and Volatility Anal

The Hidden Traps of 20-Year DRIP Simulations: Risk and Volatility Anal

A 20-year compound growth simulation of Dividend Reinvestment Plans (DRIP) introduces severe tracking errors during drawdown phases. Expense ratios and tax drags act as critical hidden risks frequently omitted from long-term backtesting models. The variance in downside protection between high-yield ETFs (SPYD) and dividend growth ETFs (SCHD) drives a cumulative return divergence exceeding 30%. The 20-year compound interest simulation utilizing a Dividend Reinvestment Plan (DRIP) serves as a persistent marketing instrument within the asset management industry. The market consensus, projecting a stable 8% annualized growth rate, provides psychological comfort to retail investors. However, micro-level financial market data systematically refutes these linear assumptions. Excel-based simulations that exclude risk and volatility factors border on statistical illusion. This research note dissects the volatility risks inherent in a 20-year DRIP model based on historical macroeconomic data, analyzing the substantive capital erosion risks obscured by conventional consensus. ...

May 19, 2026 · InvestIQs Research
Expense Ratio Compounding: 0.03% vs 0.5% Over 30 Years

Expense Ratio Compounding: 0.03% vs 0.5% Over 30 Years

A 0.47 percentage-point fee gap means 6.97% net versus 6.50% net on a 7.00% gross-return assumption.With $1,500 invested monthly for 30 years, total contributions reach $540,000 and the projected ending balance is roughly $1.74 million at 0.03% versus $1.60 million at 0.50%.The spread is about $143,000, or roughly 8% of the lower-fee ending balance, before taxes and slippage.As of Apr. 15, 2026, VOO traded near $640.44 with a 1.11% dividend yield and a 27.19 P/E, while COWZ traded near $63.02 with a 2.05% yield and a 16.77 P/E.Over the latest 5-year window cited by providers, VOO was at 12.81% annualized, SPLG at 11.42%, and COWZ at 14.61%, showing that fee alone does not explain every outcome. The fee gap that looks small until time does the math Monthly investment 20-year compound growth simulation Expense ratio is one of those numbers that looks harmless in isolation. Three basis points. Fifty basis points. That sounds like rounding error. It is not. Vanguard’s own explanation is direct: the fee is pulled from fund returns, not billed separately. That matters because the deduction happens every year, on a balance that keeps changing. ...

April 25, 2026