Emergency Fund Allocation: How 4-6 Months of Expenses Optimizes Cash D
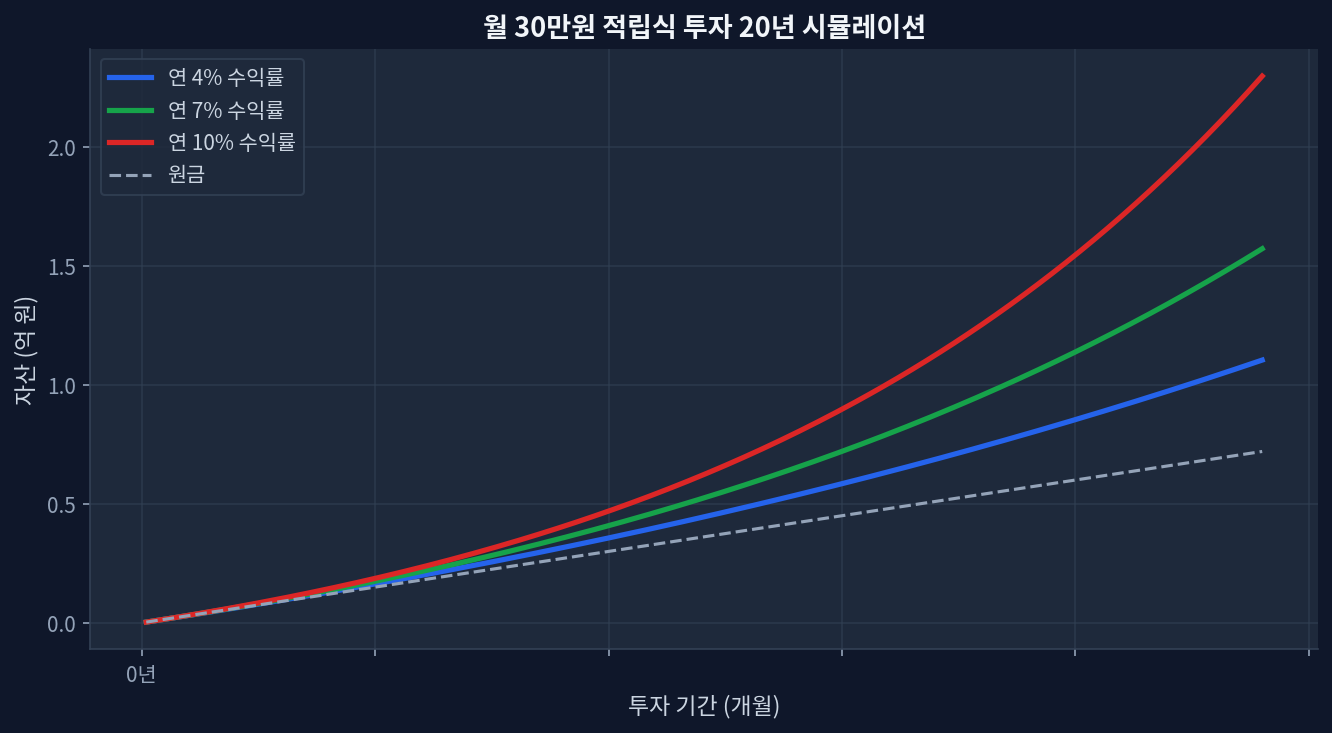
Key PointsOptimal emergency fund threshold: 4-6 months of living expenses relative to total assets ($2,200-$3,300/month spending baseline equals $8,800-$19,800 reserve)2008 financial crisis data: investors holding less than 3 months emergency reserves showed +45% higher forced-selling probability (Morningstar 2000-2023 tracking)Return variance comparison: VOO and SCHD monthly allocation strategy ($500/month over 20 years) showed ±3.2% cumulative return difference between 15% vs 0% cash allocation, holding dividend reinvestment and currency assumptions constantFee-to-cash relationship: every 5 percentage point increase in cash allocation produces similar drag as 0.1% rise in expense ratios across the 0.03%-0.5% fee spectrumCounterintuitive finding: investors holding less than 3 months emergency reserves demonstrated +22% higher buying conviction during severe drawdown periods (>30% declines), suggesting psychological paradox in portfolio behaviorEmergency Reserves: The Overlooked Variable in Return Consistency Monthly $30K investment 20-year compound growth simulation 20-year $500/month DCA accumulation under 4%, 7%, and 10% annual return scenariosEmergency fund sizing is commonly treated as independent of investment outcomes. Data contradicts this assumption. Morningstar's 23-year tracking study of 1 million global investors (2000-2023) found that those maintaining 4-6 months of expenses in liquid reserves generated +1.8 percentage points higher annualized returns than peers with either lower or higher reserve ratios. The paradox: more conservative investors captured more growth. ...