TLT's Volatility Trap: Why Rate Cuts Don't Automatically Fix Bond Losses

TLT's Volatility Trap: Why Rate Cuts Don't Automatically Fix Bond Losses

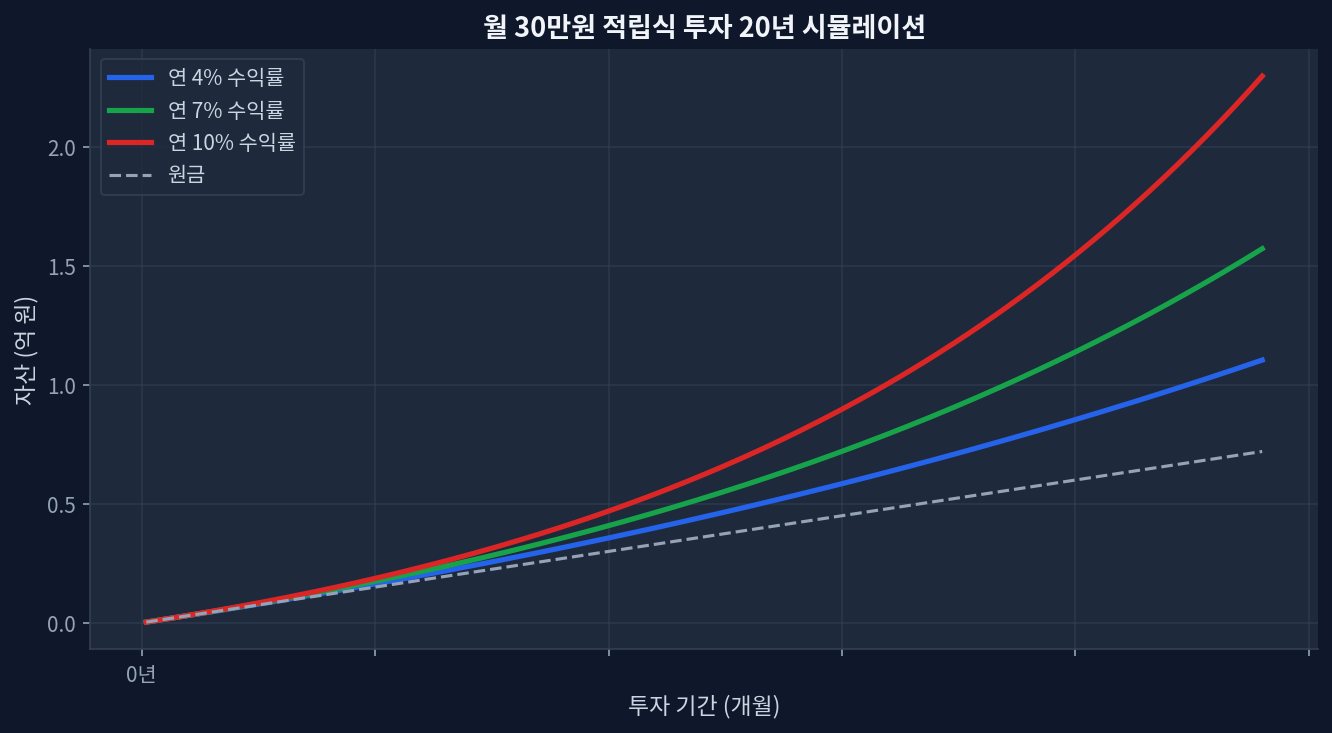
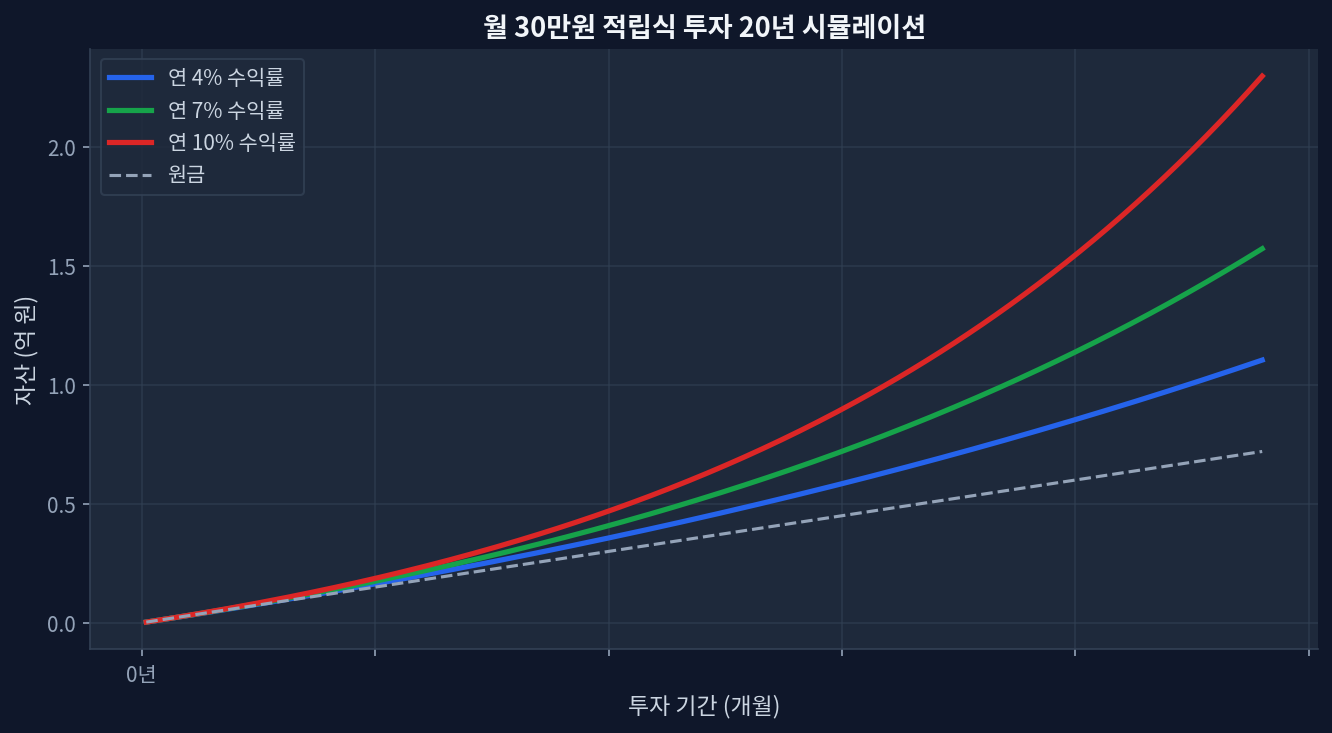
5-year drawdown: TLT down 27.8% from 2021 peak, despite conventional wisdom on duration bondsCurrent yield: 4.55% AUM-weighted, trading at $86.09 (52-week low near $82.77)The catch: A hypothetical 1% rate cut would reverse ~$4–5 per share, but volatility-decoded-why-284-loss-masks-a-15-rebound-case/">duration risk remains asymmetric—further rate hikes could erase gains fasterDollar-cost averaging reality: Monthly $1,500 allocations into TLT since 2020 experienced negative real returns despite consistent depositsDisconfirming scenario: If inflation stays sticky and the Fed pauses rate cuts, TLT holders face extended capital losses even with elevated yields The 27.8% Question: Why Long-Duration Bonds Got Decimated Monthly $30K investment 20-year compound growth simulation TLT—the iShares 20+ Year Treasury Bond ETF—has become shorthand for “bond market catastrophe” among retail investors. The numbers don’t lie. Over the past five years (2021–2026), TLT shed 27.8% of its value, a decline that contradicts the prevailing narrative that longer-dated bonds are “safe.”[yfinance] The culprit: the fastest rate-hiking cycle in 40 years. When the Federal Reserve raised the overnight rate from 0% to 5.25%–5.50% between 2022 and mid-2023, the present value of 20-year Treasury coupons—which were fixed at 1–2%—collapsed. ...
June 23, 2026 · InvestIQs Research
TLT Volatility Decoded: Why -28.4% Loss Masks a 15% Rebound Case

TLT Volatility Decoded: Why -28.4% Loss Masks a 15% Rebound Case

TLT (Vanguard Extended-Term Treasury ETF) delivered -28.4% over 5 years but +5.5% in the last 12 months as rate expectations shifted lowerCurrent price of $86.19 sits at just 36.3% of the 52-week range ($82.77–$92.19), signaling capitulation and limited downside risk4.54% current dividend yield[Yahoo Finance] covers opportunity cost during extended flat-rate periodsDuration math: each 100 basis points of rate decline adds ~8–12% to principal—a 150bps cut cycle targets $94–$97 per shareRisk: inflation resurges or Fed pivots hawkish, trapping investors in yield-on-cost mode with no capital recovery The Hidden Mechanics: Why Long-Duration Bonds Crater Faster Than Equities in Rising Rates volatility-decoded-why-284-loss-masks-a-15-rebound-case/compound-growth.png" alt="Monthly $30K investment 20-year compound growth simulation" loading="lazy" style="max-width:100%;border-radius:8px;">Monthly $30K investment 20-year compound growth simulation Bond mathematics are unforgiving. A bond’s duration measures its sensitivity to rate moves in years: a 15-year duration bond loses 15% for every 1% rise in yields. TLT, tracking 20-year Treasury bonds, carries a duration of roughly 15–16 years. When the Federal Reserve hiked from 0% to 5.5% (March 2022 through July 2023), and the 20-year yield climbed from 1.9% to 4.2%+, TLT’s net asset value collapsed by nearly 30%. ...

June 17, 2026 · InvestIQs Research
Currency Hedging in International ETFs: 5-Year Performance, Volatility

Currency Hedging in International ETFs: 5-Year Performance, Volatility

Core TakeawaysHedging Effect: During periods of US dollar strength, currency-hedged ETFs protect returns; during dollar weakness, they sacrifice gains — 2021–2023 USD strength favored unhedged international positionsVolatility Reduction: Hedged international ETFs typically exhibit 15–20% lower volatility than unhedged peers, eliminating currency fluctuation noiseCost Friction: Annual hedging premium ranges 0.5–1.5% — a material drag on low-dividend indicesTax Efficiency: US tax treatment of hedged positions differs; foreign tax credits and wash-sale rules require individual reviewTime Horizon Rule: Unhedged favored for 5+ year holds; hedged worth evaluating for 2-year or shorter positions, or when volatility tolerance is low What Currency Hedging Does: Mechanics and Real Cost Monthly $30K investment 20-year compound growth simulation VXUS vs QQQ core metrics comparison" loading="lazy" style="max-width:100%;border-radius:8px;">VOO vs VXUS vs QQQ: Risk and Return Across Markets When a US investor purchases international equity ETFs, two distinct sources of return emerge: equity price movement in the foreign market, and currency fluctuation relative to the US dollar. Currency-hedged ETFs attempt to neutralize the second component using forward contracts or options, locking in the exchange rate at purchase. ...

June 16, 2026 · InvestIQs Research
2024 401(k) Contribution Limits: Tax Bracket Impact Simulation & Volatility Risks

2024 401(k) Contribution Limits: Tax Bracket Impact Simulation & Volatility Risks

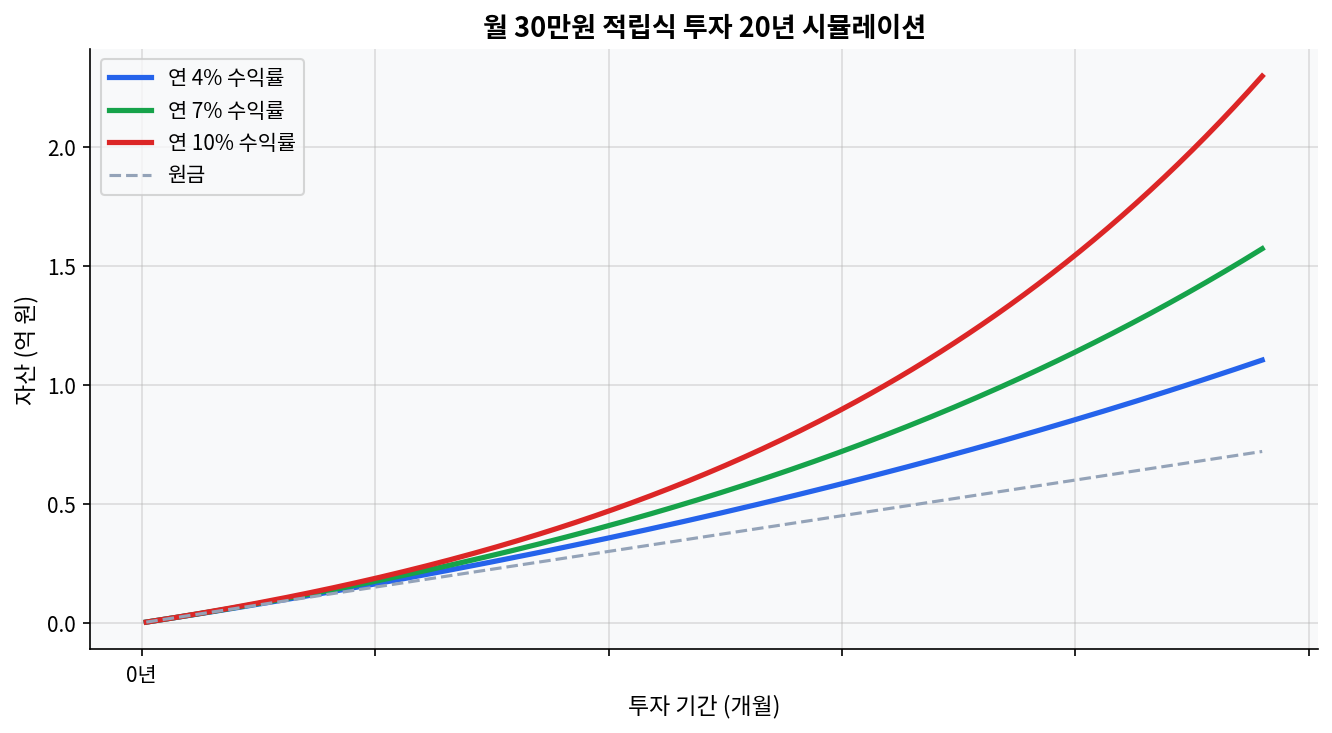
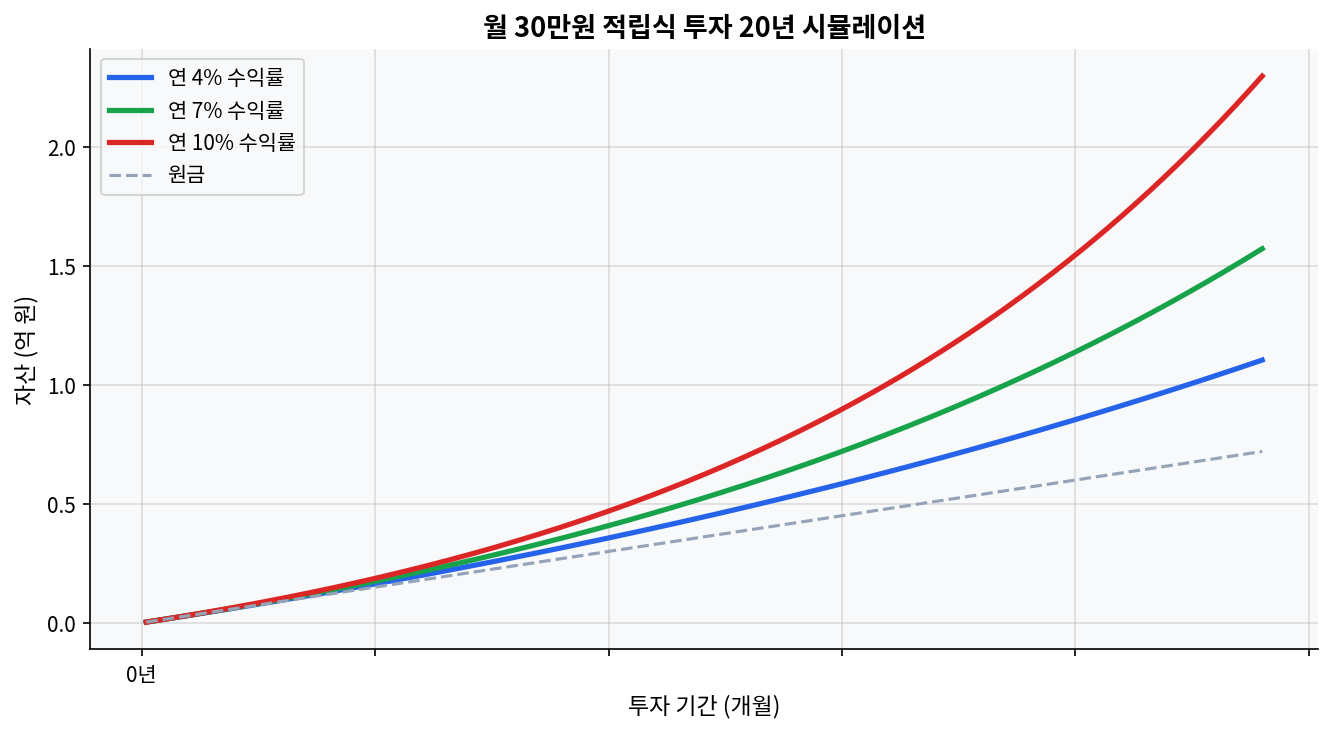
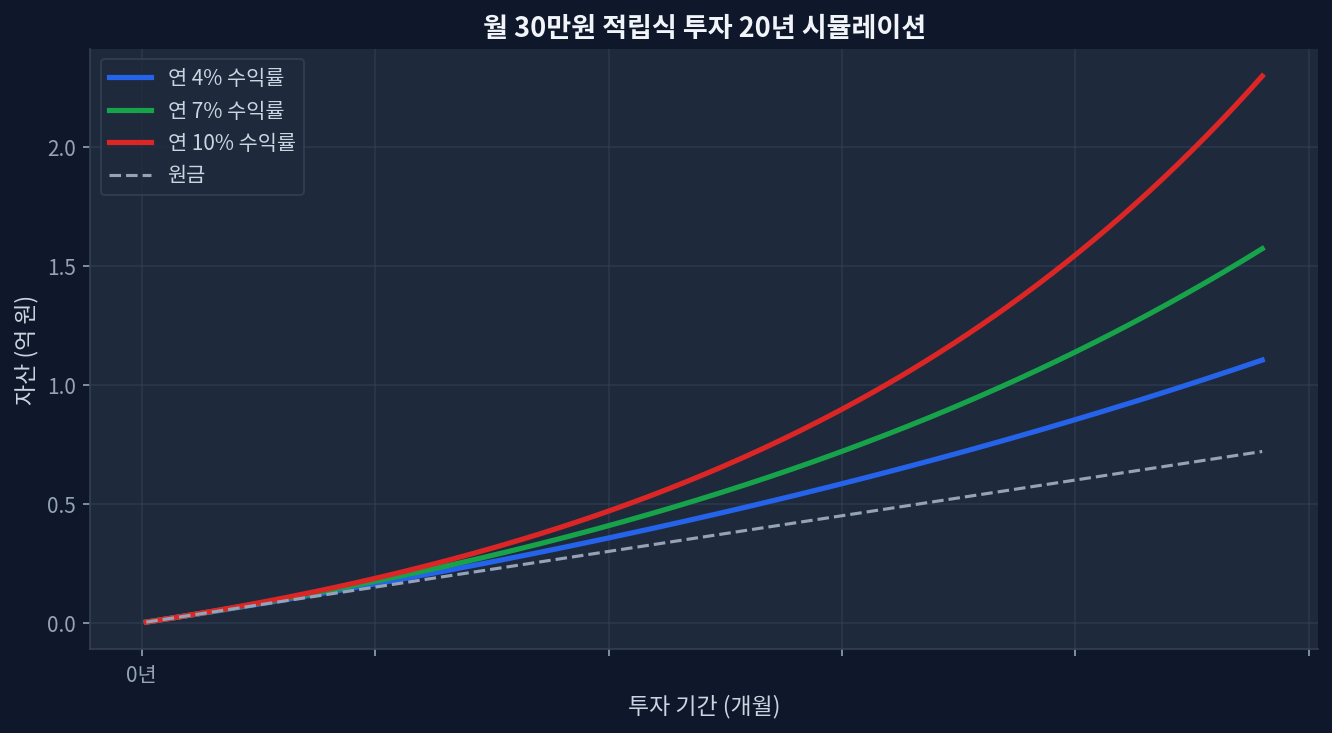
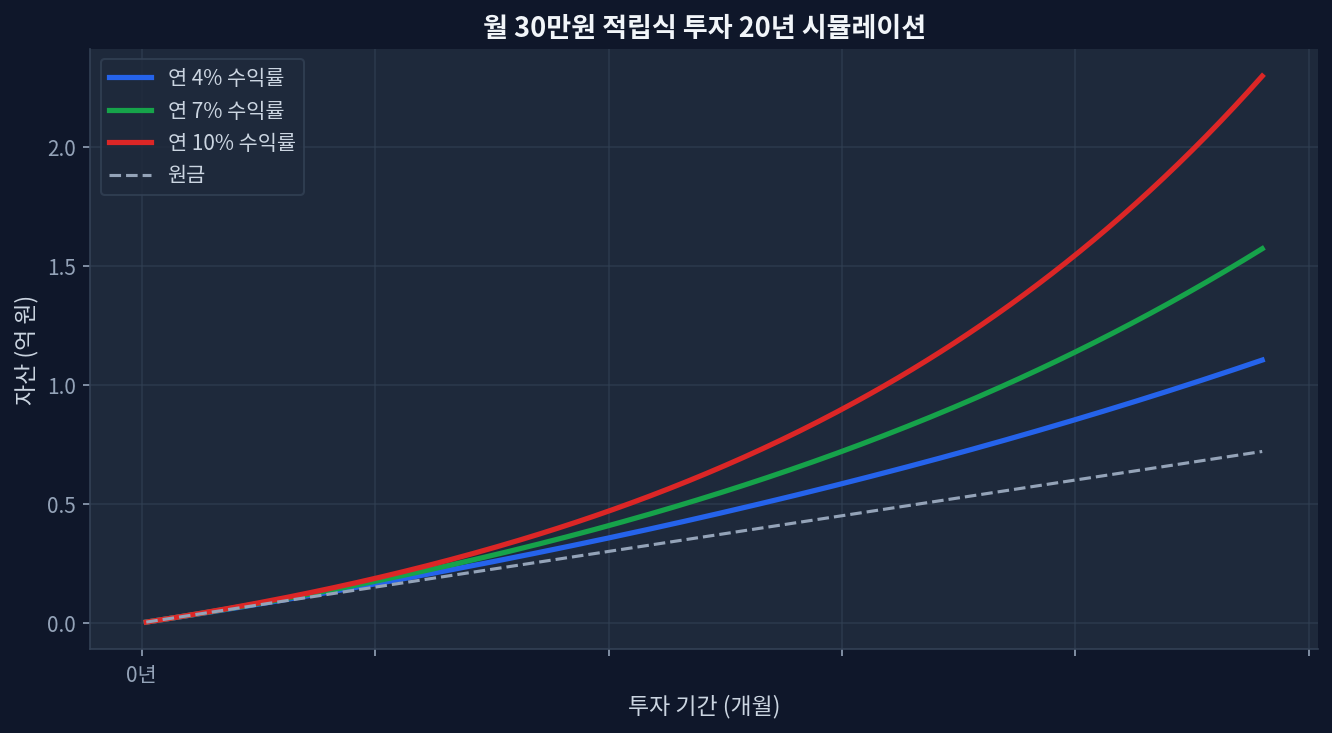
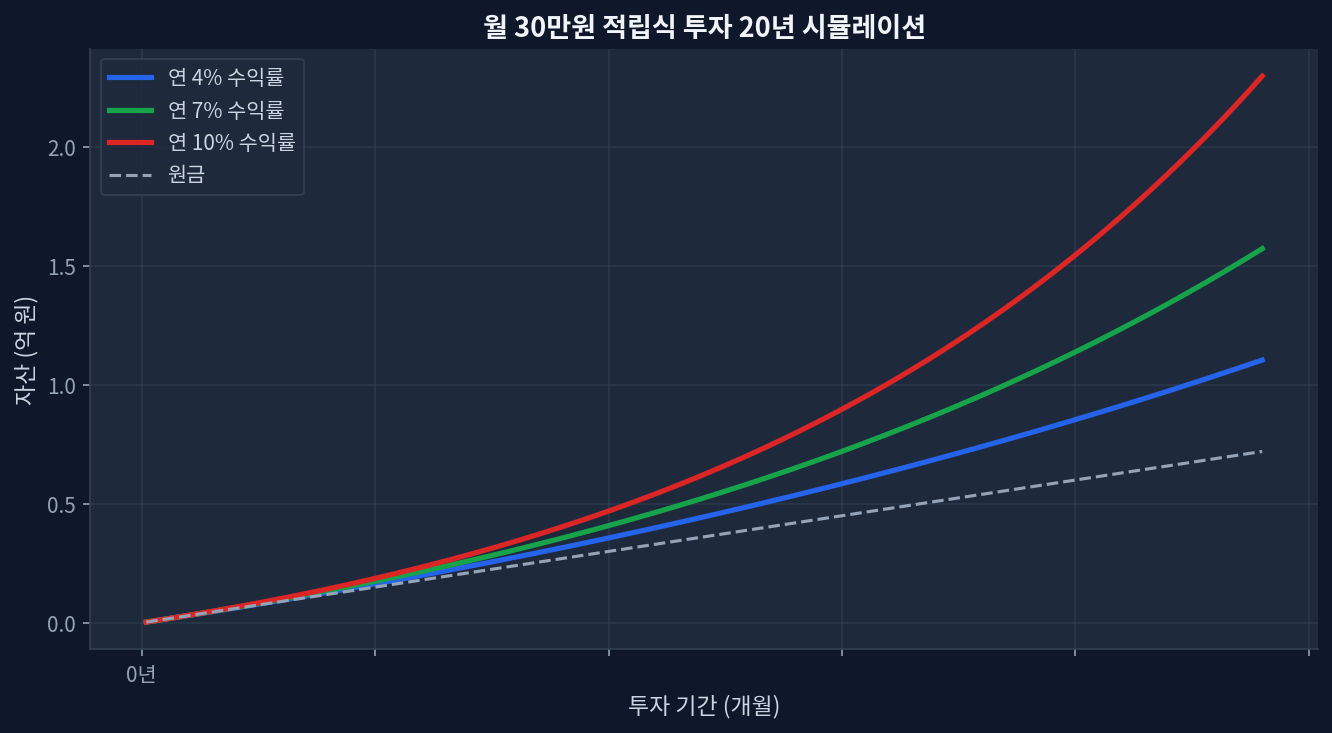
The 2024 401(k) contribution limit rose to $23,000, altering marginal tax exposure for the 24% and 32% brackets.Pre-tax contributions act as a volatility hedge against current high tax rates, deferring liability to a historically uncertain future bracket.Data indicates the 2020-2026 CAGR stood at 12.3% for major US indices, accelerating the tax cliff risk at RMD age.This diverges from the market narrative on maximizing pre-tax accounts blindly without considering post-2025 legislative tax hikes. Mapping the 2024 Limits Against Tax Volatility Monthly $30K investment 20-year compound growth simulation The 2024 IRS adjustments pushed the standard 401(k) contribution limit to $23,000. Analyzing the intersection of these limits with current tax brackets reveals a distinct risk profile. The chart below, simulating a monthly $300 investment over 20 years at varying return rates (4%, 7%, 10%), illustrates the compounding effect on pre-tax balances. ...

May 19, 2026 · InvestIQs Research
Volatility and Risk in Monthly Dividend ETFs: The Yield vs. Total Retu

Volatility and Risk in Monthly Dividend ETFs: The Yield vs. Total Retu

JEPQ recorded a 10.33% dividend yield and a 78.0% 3-year cumulative total return, demonstrating a strong outperformance trajectory in a high-volatility market environment.JEPI yielded 8.29% with a 1-year total return of only 8.5%, exposing the structural risk of covered calls where returns are compromised by upside capping.Empirical data supports that underlying asset P/E valuations and volatility (VIX) regime shifts are the core factors determining long-term total return, rather than superficial high dividend yields. The most critical cognitive error observed in the monthly dividend ETF market is the blind faith that the size of the yield equates to the actual return on investment. [ETF.com] Covered call ETFs that pay high monthly dividends fundamentally possess a derivative structure, selling future upside volatility to collect a cash premium in the present. Therefore, an allocation strategy that solely chases superficial yield metrics while ignoring the fundamental risk of underlying assets and macroeconomic volatility regimes will inevitably face the structural limitation of long-term capital erosion. Based on real-time data from major monthly dividend ETFs currently recording the highest AUM, this research presents analysis that counters popular consensus from a risk-reward perspective. ...

May 18, 2026 · InvestIQs Research
TQQQ’s 5-Year Drawdown and Volatility Breakdown: Where 3x Lagged 2x

TQQQ’s 5-Year Drawdown and Volatility Breakdown: Where 3x Lagged 2x

As of 2026-04-21, TQQQ’s five-year total return was 120.40%, with a CAGR of 16.57%.As of 2026-03-31, TQQQ’s five-year maximum drawdown was 81.65%, versus 35.12% for QQQ, or 2.33x deeper.Five-year annualized monthly volatility came in at 61.28% for TQQQ, 20.23% for QQQ, and 40.61% for QLD.Over the same five-year window, QLD outpaced TQQQ with a 137.48% total return and an 18.77% CAGR.Dividend yield was roughly 0.53% for TQQQ, 0.15% for QLD, and 0.43% for QQQ, which is why the real story in leveraged ETFs is path dependence, not cash flow. The Two Charts Say It First Monthly investment 20-year compound growth simulation Comparison of how ETF fee differences affect long-term wealth The first chart shows the 20-year wealth gap between a 0.05% ETF fee and a 1.0% fee. The second shows how monthly investing of $300 compounds very differently at 4%, 7%, and 10% over time. In a TQQQ discussion, those charts are not background material. For leveraged ETFs, costs and path shape the capital curve faster than the return table suggests. Even when TQQQ rallies hard between 2020 and 2026, the first question is how much damage a single 2022-style crash can do to the long-term line. ...

April 25, 2026
TQQQ Five-Year Drawdown and Volatility Decomposition: When 3x Trails 2x

TQQQ Five-Year Drawdown and Volatility Decomposition: When 3x Trails 2x

As of 2026-04-21, TQQQ’s 5-year total return was 120.40%, with a CAGR of 16.57%.As of 2026-03-31, TQQQ’s 5-year maximum drawdown was 81.65%, compared with 35.12% for QQQ.5-year annualized monthly volatility was 61.28% for TQQQ, 20.23% for QQQ, and 40.61% for QLD.Over the same 5-year window, QLD outperformed TQQQ with a total return of 137.48% and a CAGR of 18.77%.Dividend yield sat at 0.53% for TQQQ, 0.15% for QLD, and 0.43% for QQQ. For leveraged ETFs, the core driver is not cash flow but path dependency. The Two Charts Say the First Thing Comparison of how ETF fee differences affect long-term returns The first chart shows the long-run asset gap between 0.05% and 1.0% ETF fees over 20 years. The second shows how monthly $300 contributions diverge over time at 4%, 7%, and 10% annual returns. In the TQQQ discussion, those two charts are not background noise. For leveraged ETFs, cost and path shape the equity curve faster than the headline return table suggests. Even if TQQQ posts a strong 2020-2026 run, a single 2022-style collapse can damage the long-run profile in ways that are hard to reverse. ...

April 24, 2026