Dividend Retirement Blueprint: REITs & SCHD Allocation for Monthly Cash Flow

Dividend Retirement Blueprint: REITs & SCHD Allocation for Monthly Cash Flow

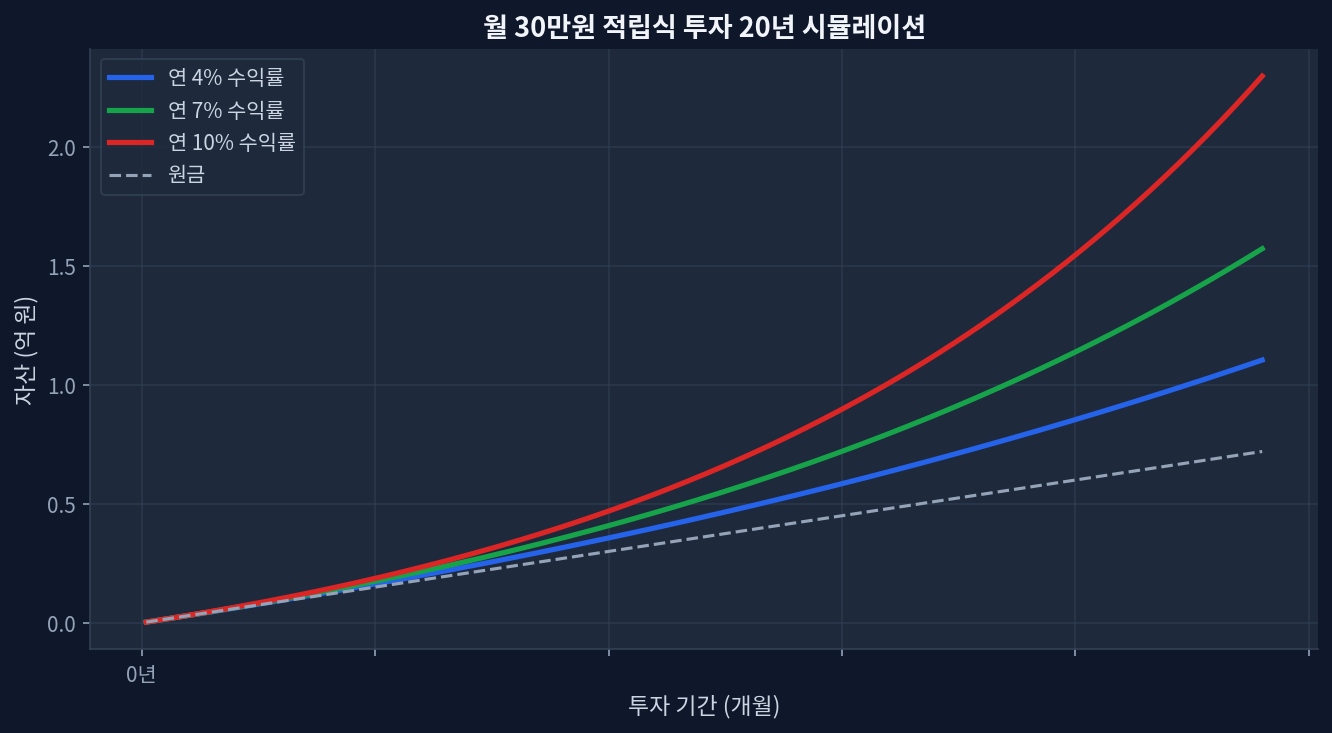
SCHD (dividend-focused ETF): 3.25% yield, +26.5% 1Y return, $31.96 current price as of late June 2026VIG (dividend growth): 1.47% yield but +71.5% 5-year total return; P/E 26.2 signals premium valuation50:50 split targets $3K USD monthly cash flow, though actual withdrawal depends on market timing and sequence-of-returns riskREIT inclusion adds inflation hedge and non-correlated income, but sector drawdowns (2022) exceeded equity losses by 30%+ in some casesReality check: 3.25% SCHD yield alone generates only ~$975/month on a $360K base; reaching $3K/month requires either $920K portfolio or supplemental bond allocation Why 50:50 Between SCHD and REITs? Portfolio Fragmentation vs. Concentration Monthly $30K investment 20-year compound growth simulation The conventional retirement wisdom—“hold diversified dividend stocks”—glosses over a critical tension. A pure dividend-growth approach (like VIG’s 26.2 P/E) chases price appreciation alongside income, creating drag during yield-focused market downturns. REITs and high-yield equity funds (SCHD) trade at lower valuations because they distribute most taxable income rather than reinvesting, but that efficiency comes with sector risk concentration. ...
June 26, 2026 · InvestIQs Research
SCHD in Tax-Free Accounts: Why 20-Year Compounding Beats 2M KRW in Annual Savings

SCHD in Tax-Free Accounts: Why 20-Year Compounding Beats 2M KRW in Annual Savings

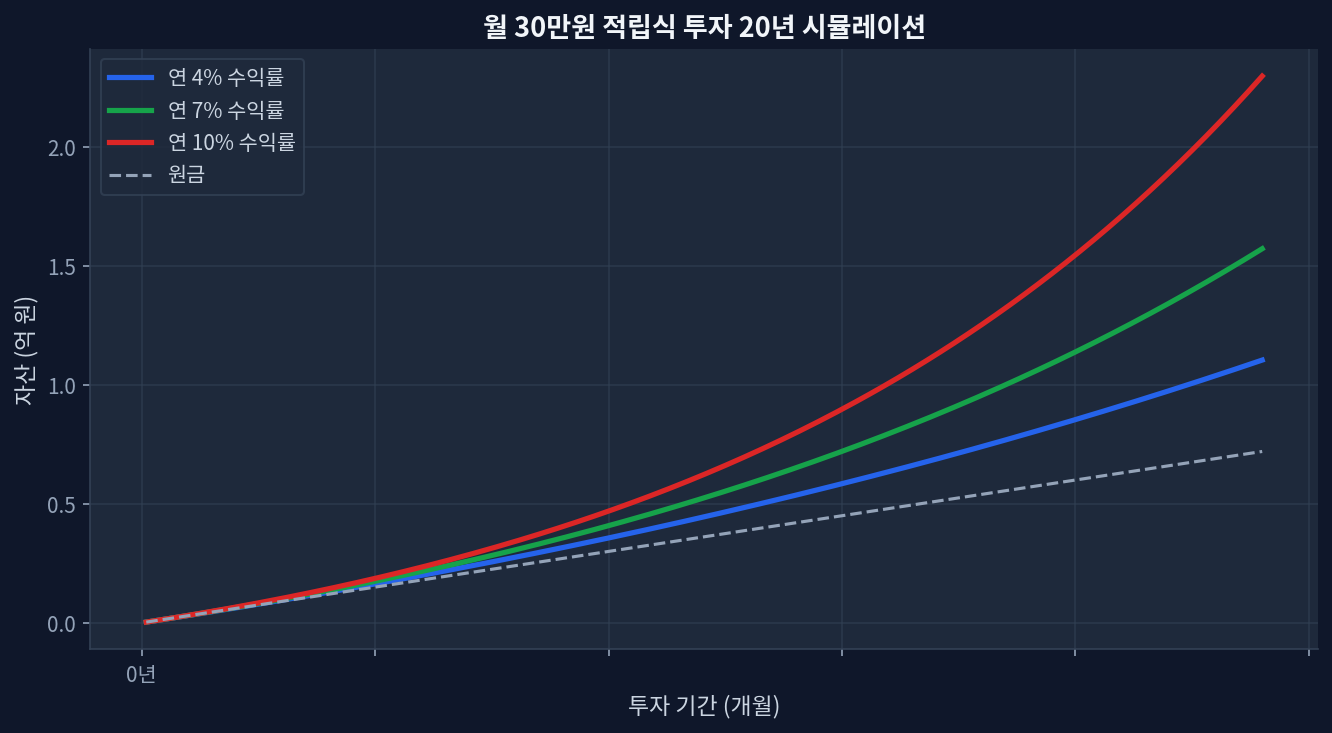
SCHD's 3.25% yield — annualizing ~$10.5M USD in distributions across 94.9B AUM (Jan 2026)Tax-free growth over 20 years at 7% average return compounds to 3.87x initial investment, vs. 2.87x after taxes200만원 saved in year 1 becomes 650만원+ in tax-deferred gains by year 10 (no withdrawals)SCHD trades at 19.0 P/E, 480 bps below broader dividend-growth peer VIG (26.0 P/E)Catch: momentum risk is real — SCHD at 52-week high (90.4%), vulnerability to rate shocks and sector rotation The Compounding Angle: Why Simple Tax Savings Miss the Real Picture Monthly $30K investment 20-year compound growth simulation Tax-advantaged accounts create a deceptive math problem. Investors fixate on annual tax savings — 200만원 per year on a 2000만원 contribution — and miss the exponential tail. The real edge comes not from avoiding taxes today, but from letting tax-free dividends reinvest and compound for decades. ...

June 11, 2026 · InvestIQs Research
Structuring a Late-Stage Retirement Portfolio: Analyzing SCHD's Dividend Efficacy for Investors in Their 50s

Structuring a Late-Stage Retirement Portfolio: Analyzing SCHD's Dividend Efficacy for Investors in Their 50s

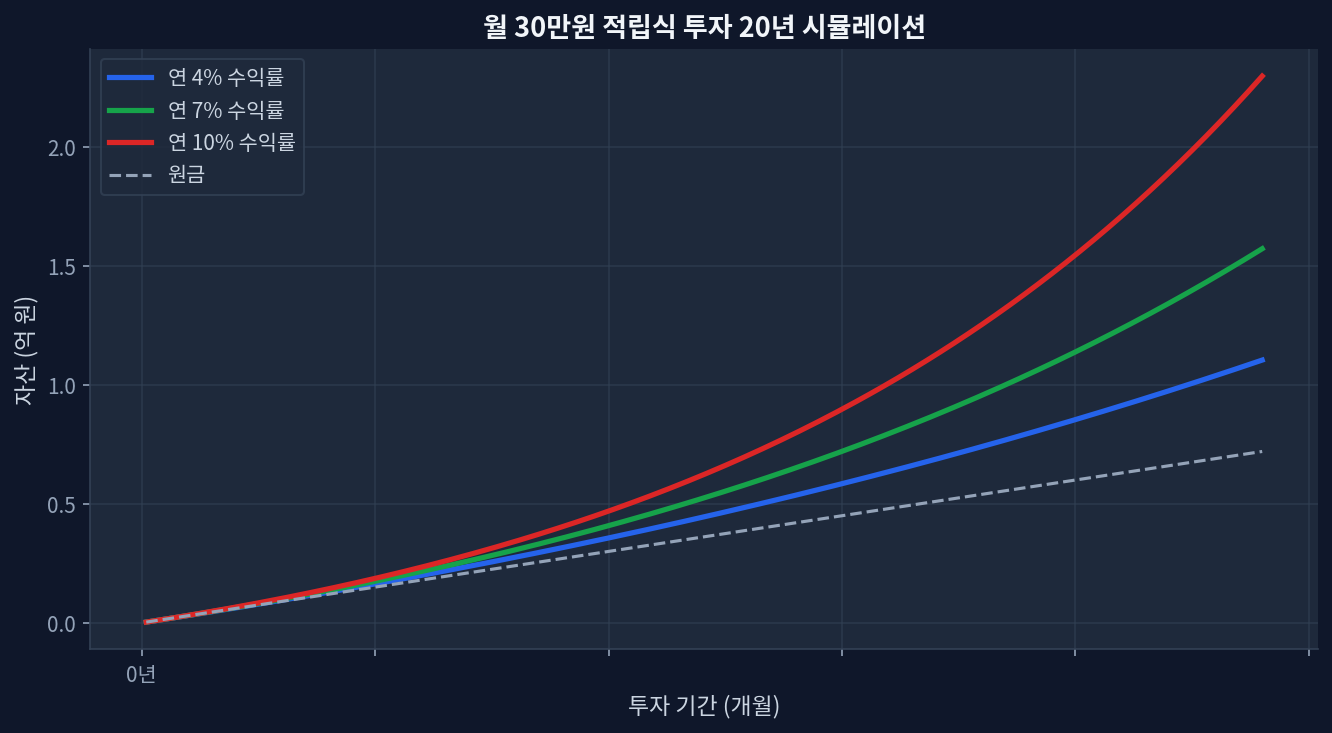
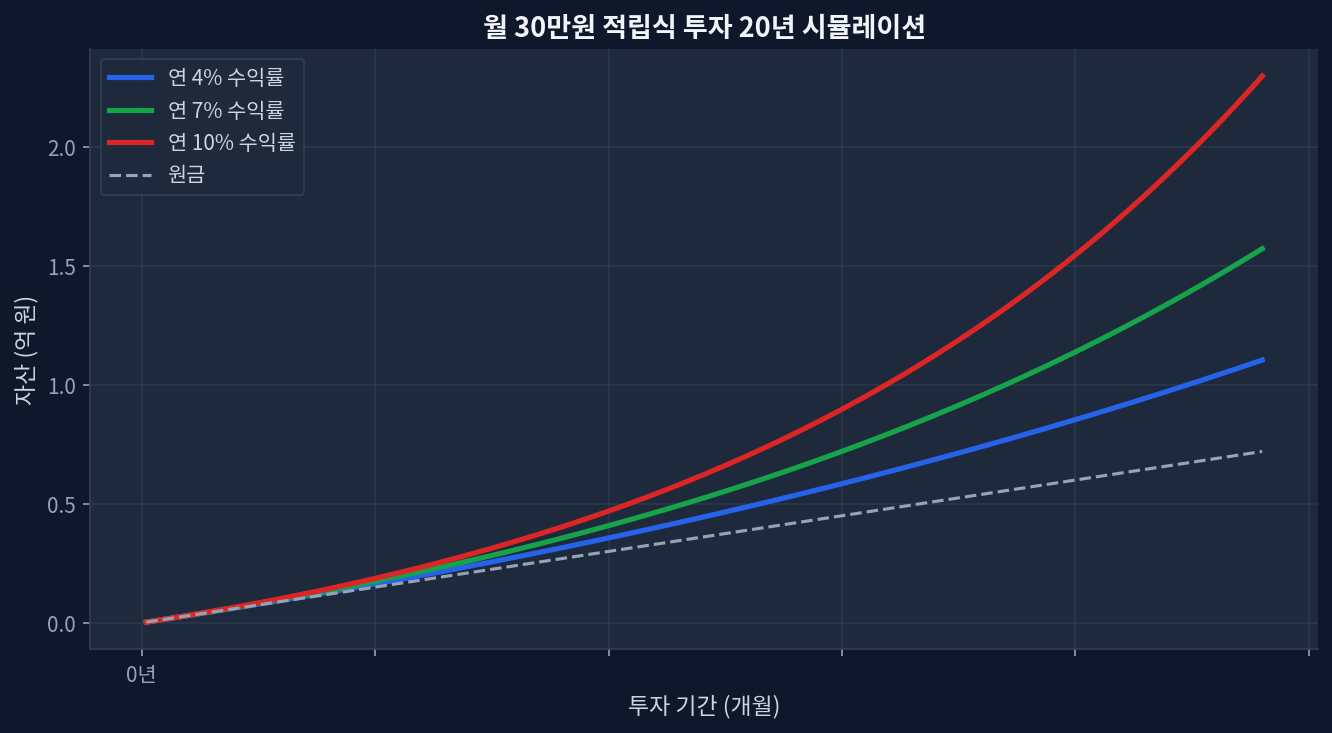
SCHD currently yields 3.21% trading at a 19.5 P/E, presenting a distinct valuation discount against VIG's 1.48% yield and 26.2 P/E. Trailing 5-year data shows VIG (+66.4%) outpacing SCHD (+53.7%), highlighting the persistent growth versus yield tradeoff in modern asset allocation. Short-term momentum favors SCHD, which posted a +31.3% 1-year return, driving the asset to 99.1% of its 52-week range ($32.83). Relying solely on historical dividend growth can lead to an incomplete risk assessment, requiring explicit modeling of market drawdowns and shifting rate environments. Redefining Yield and Growth in the Accumulation Phase Monthly $30K investment 20-year compound growth simulation Observing the chart below, which illustrates a 20-year monthly accumulation simulation, the trajectory of compound growth at varying rates highlights the mathematical reality of long-term investing. For demographic cohorts entering their 50s—similar to the target audience of late-stage planning frameworks—the capital accumulation runway compresses significantly. This structural reality shifts the analytical priority away from maximizing top-line beta exposure toward sequence-of-returns protection and generating reliable cash flow. ...

May 25, 2026 · InvestIQs Research
20-Year DRIP Reinvestment Simulation: Risk Data vs. Consensus Assumptions

20-Year DRIP Reinvestment Simulation: Risk Data vs. Consensus Assumptions

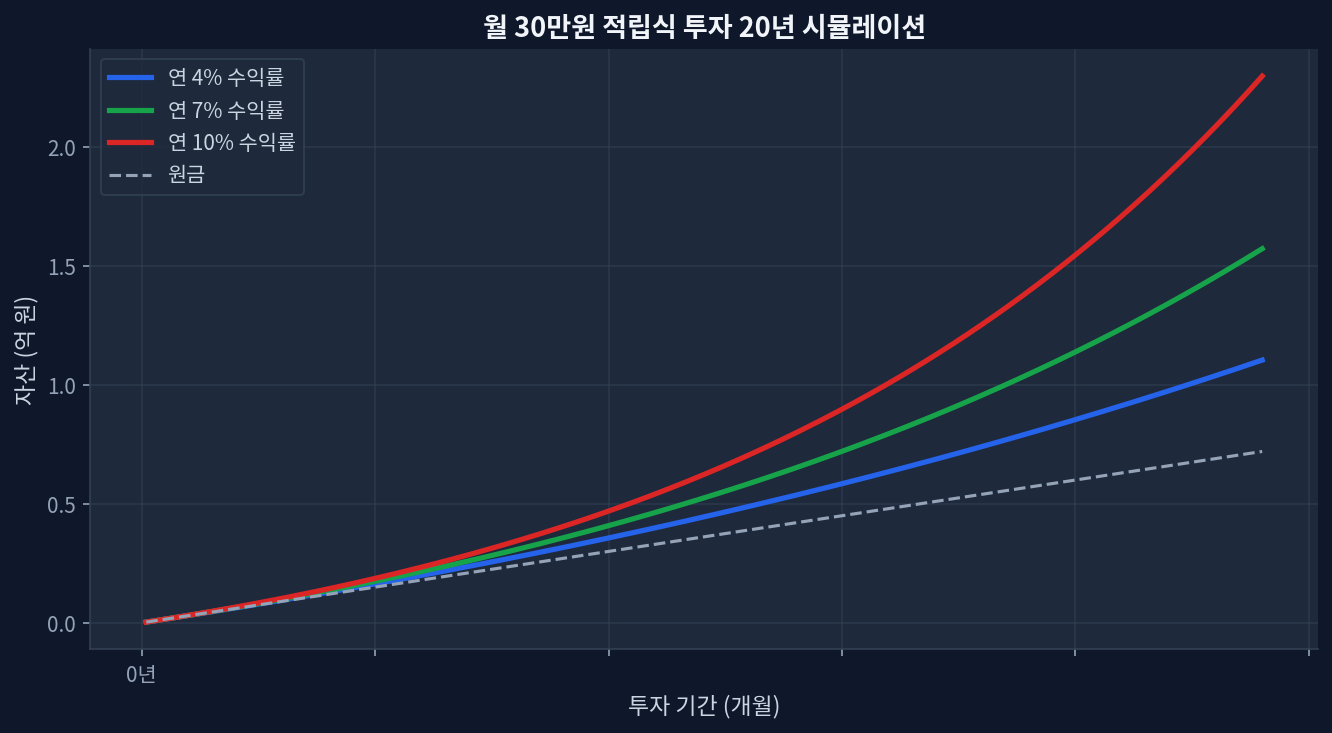
$1,500/month at 7% DRIP CAGR over 20 years = ~$782K; at 4%, ~$550K — a $232K gap driven entirely by the assumed return rateEvery 1% shift in assumed return adds or removes ~$110K–$130K in terminal value at year 20; sensitivity is nonlinearTax drag in taxable accounts reduces effective reinvestment yield by 15–25%; account type is a primary, not secondary, variable2020 S&P dividend cuts (~14% aggregate quarterly reduction) pushed realized DRIP rates 200bps below model assumptions for high-yield ETFsDRIP reinvestors during the Q1 2020 drawdown outperformed non-reinvestors by 12–18% by year-end — a volatility effect flat-line models ignore entirely What the 20-Year Simulation Data Actually Shows Monthly $30K investment 20-year compound growth simulation Running $1,500/month at 4%, 7%, and 10% for 20 years produces a divergence that widens sharply in the back half of the period. At year 10, the gap between the 4% and 10% paths is roughly $200K. By year 20, that gap exceeds $590K. The simulation chart above captures the inflection clearly: the 10% curve breaks away from the 4% path around year 12, when accumulated DRIP dividends begin compounding on themselves at scale.[FRED] ...

May 17, 2026 · InvestIQs Research
SCHD Dividend Growth Rate: 10-Year Trajectory — Separating Myth from Data

SCHD Dividend Growth Rate: 10-Year Trajectory — Separating Myth from Data

SCHD current price $31.72, dividend yield 3.29% — trading at 93.6% of 52-week range ($25.69–$32.13), effectively at multi-year highs1-year return +24.7% outpaces VIG +17.9%, but 5-year cumulative stands at SCHD +48.2% vs VIG +62.7% — a 14.5pp total-return gap favoring VIGDividend yield: SCHD 3.29% vs VIG 1.51% — a 2.2x spread, material for cash-flow-priority investorsP/E: SCHD 18.8 vs VIG 26.6 — lower valuation for SCHD reflects sector composition, not a quality discount10-year dividend growth fell to single digits after 2022 rate hikes — the "12% annual growth" narrative is a low-rate-era artifact Anatomy of a Dividend ETF Myth: Is SCHD the King of Dividend Growth? Monthly $30K investment 20-year compound growth simulation Required capital to generate $1,000 monthly dividend income at SCHD's current 3.29% yield Within dividend investing communities, SCHD occupies near-sacred status. Since 2020, the equation “dividend ETF = SCHD” has solidified among retail investors, supported by AUM of $91.1B, a dividend yield of 3.29%, and a 1-year return of +24.7%. [Yahoo Finance] Dissecting a full decade of quarterly dividend data, however, reveals uncomfortable terrain: growth rates are rate-cycle-dependent, and on a total-return basis, SCHD trails competing ETFs over extended horizons. The distance between myth and data warrants a quantitative examination. ...

May 16, 2026 · InvestIQs Research