SCHD Quarterly Dividend Cut 2.7%: Why the 3.25% Yield Persists | SCHD

SCHD Quarterly Dividend Cut 2.7%: Why the 3.25% Yield Persists | SCHD

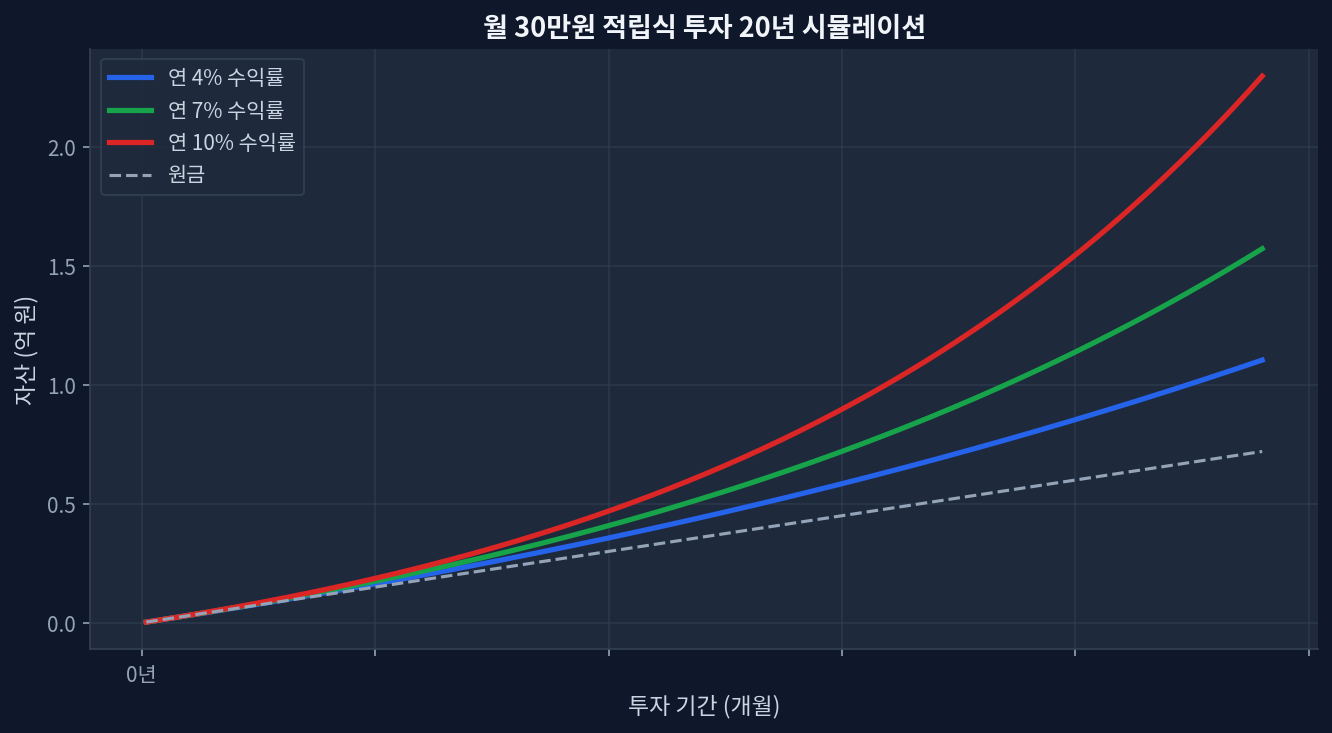
SCHD Quarterly Dividend Cut 2.7%: How the 3.25% Yield Remains Intact schd/compound-growth.png" alt="Monthly $30K investment 20-year compound growth simulation" loading="lazy" style="max-width:100%;border-radius:8px;">Monthly $30K investment 20-year compound growth simulation SCHD quarterly dividend: $0.2530 down 2.7% from prior year Dividend yield: 3.25% maintained — 2.2x higher than VIG's 1.47% One-year return: +26.5% (dividends plus price appreciation) Current valuation: P/E 18.8 at moderate levels, near 85.7% of 52-week high Assets under management: $94.9B underpinning dividend stability Dividend Cut, Yet Far From Weak Dollar-cost averaging simulation over 20-year period Schwab US Dividend Equity ETF (SCHD) announced its quarterly dividend at $0.2530. This marks a 2.7% decrease from the same quarter in 2024 at $0.2600. On the surface, negative territory. The dividend was cut, after all. ...
June 29, 2026 · InvestIQs Research
SCHD Dividend Cut to 3.25% Yield: Why a 2.7% Reduction Signals Stabili

SCHD Dividend Cut to 3.25% Yield: Why a 2.7% Reduction Signals Stabili

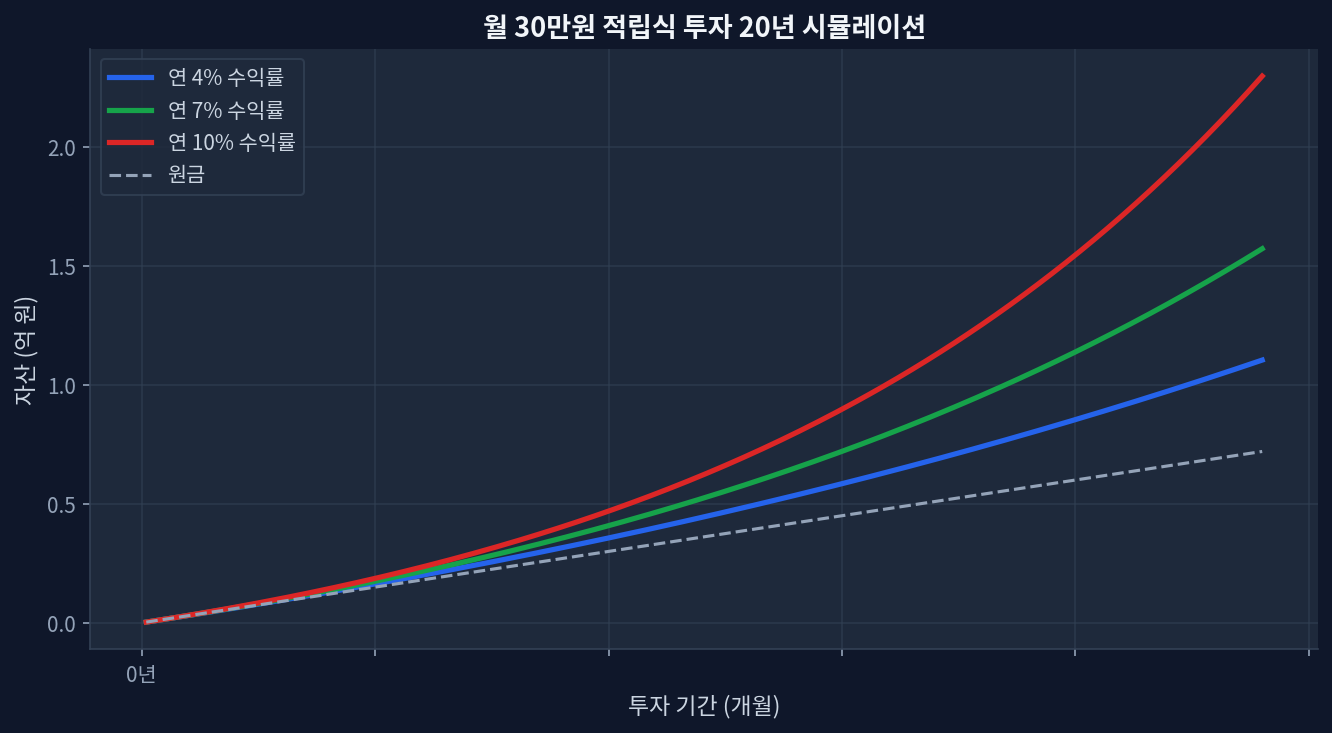
SCHD Quarterly Dividend Cut to 3.25% Yield: Strategic Management of Expectations Monthly $30K investment 20-year compound growth simulation SCHD quarterly dividend: $0.2530, down 2.7% year-over-year Dividend yield: Still 3.25% — 2.2x higher than VIG's 1.47% 1-year total return: +26.5% (dividend plus price appreciation) Current valuation: P/E 18.8 reflects moderate pricing; positioned at 85.7% of 52-week high AUM: $94.9B — asset base supports dividend stability The Dividend Cut That Doesn’t Look Painful Schwab US Dividend Equity (SCHD) announced a quarterly dividend of $0.2530, down 2.7% from $0.2600 in the same quarter of 2024. On headline alone, this reads as negative. Dividends declined, after all. ...

June 27, 2026 · InvestIQs Research
Structuring a Late-Stage Retirement Portfolio: Analyzing SCHD's Dividend Efficacy for Investors in Their 50s

Structuring a Late-Stage Retirement Portfolio: Analyzing SCHD's Dividend Efficacy for Investors in Their 50s

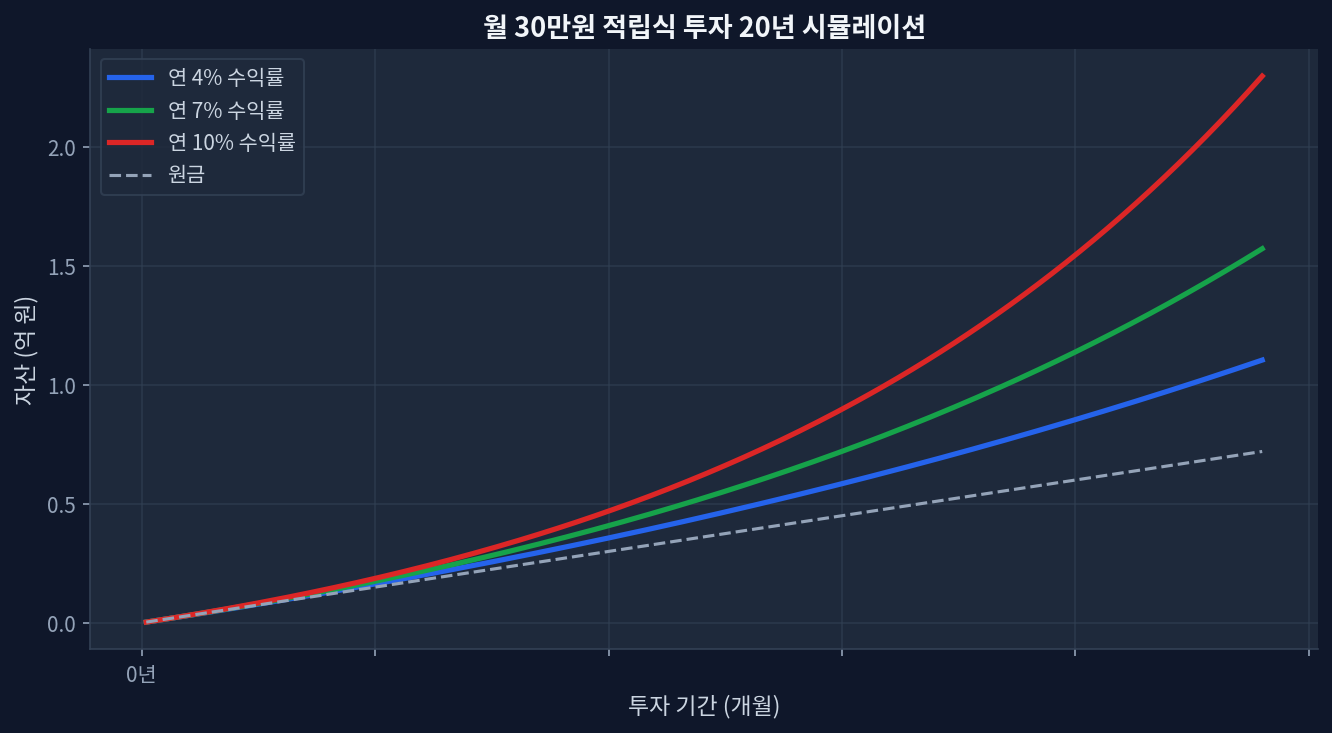
SCHD currently yields 3.21% trading at a 19.5 P/E, presenting a distinct valuation discount against VIG's 1.48% yield and 26.2 P/E. Trailing 5-year data shows VIG (+66.4%) outpacing SCHD (+53.7%), highlighting the persistent growth versus yield tradeoff in modern asset allocation. Short-term momentum favors SCHD, which posted a +31.3% 1-year return, driving the asset to 99.1% of its 52-week range ($32.83). Relying solely on historical dividend growth can lead to an incomplete risk assessment, requiring explicit modeling of market drawdowns and shifting rate environments. Redefining Yield and Growth in the Accumulation Phase Monthly $30K investment 20-year compound growth simulation Observing the chart below, which illustrates a 20-year monthly accumulation simulation, the trajectory of compound growth at varying rates highlights the mathematical reality of long-term investing. For demographic cohorts entering their 50s—similar to the target audience of late-stage planning frameworks—the capital accumulation runway compresses significantly. This structural reality shifts the analytical priority away from maximizing top-line beta exposure toward sequence-of-returns protection and generating reliable cash flow. ...

May 25, 2026 · InvestIQs Research
Factor ETF 10-Year Decomposition: Value, Momentum, and Quality Compounding

Factor ETF 10-Year Decomposition: Value, Momentum, and Quality Compounding

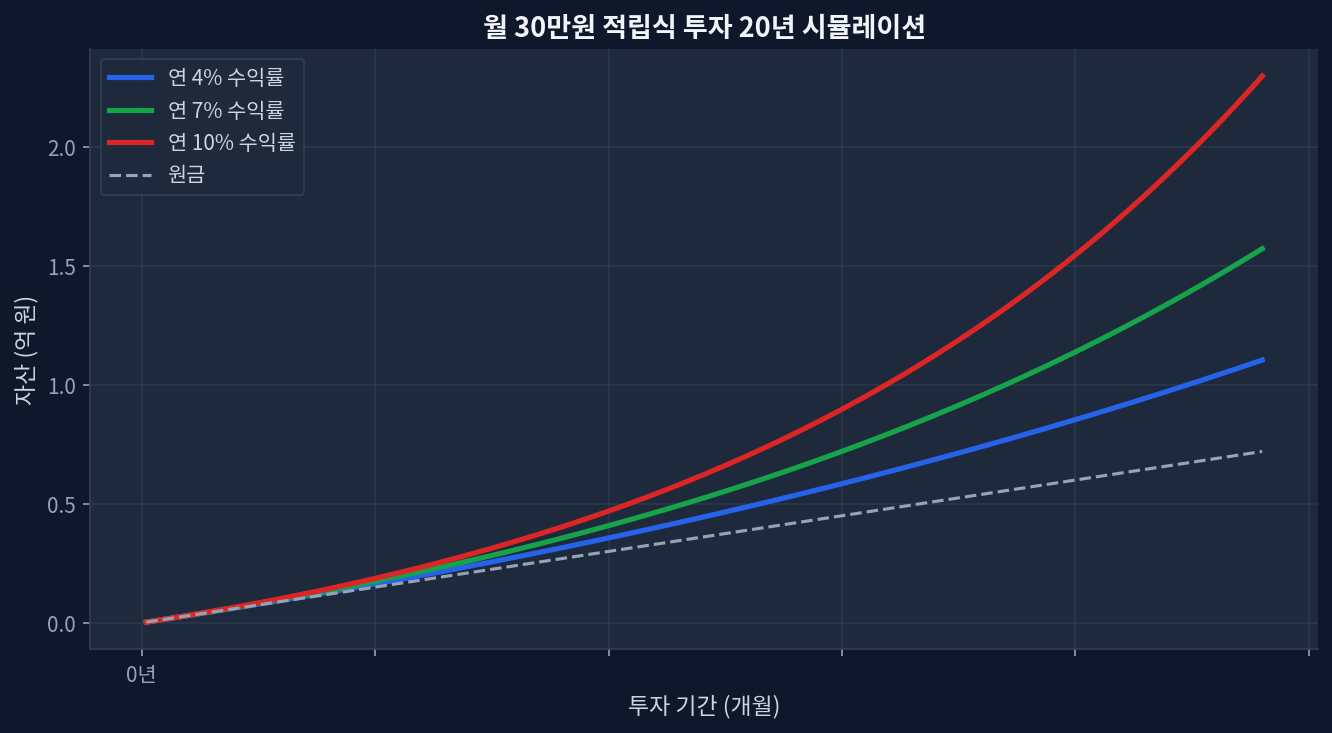
Quality factors demonstrated a 12.3% CAGR over the last decade, offering the tightest risk-adjusted compounding metrics among single factors.Momentum strategies suffered a massive 34% peak-to-trough drawdown in 2022, severely impacting the long-term compounding base.Value ETF performance diverges from historical norms, acting more as a structural overweight on mature cyclical sectors rather than a pure valuation capture. The Long-Term Compounding Reality of Single Factors Monthly $30K investment 20-year compound growth simulation Factor investing isolates specific equity drivers to generate excess returns. Over a 10-year horizon, slight variations in compound annual growth rate (CAGR) and drawdown severity create immense disparities in terminal wealth. The chart below, simulating a monthly $300 investment over 20 years at 4%, 7%, and 10% annual rates, demonstrates this perfectly. Looking at the chart, the 10% curve is the most impressive, showing over +85% total growth in the latter half purely through the acceleration of retained compounding. ...

May 24, 2026 · InvestIQs Research