Roth IRA vs Traditional IRA: 5-Scenario Capital Gains Tax Decomposition

Roth IRA vs Traditional IRA: 5-Scenario Capital Gains Tax Decomposition

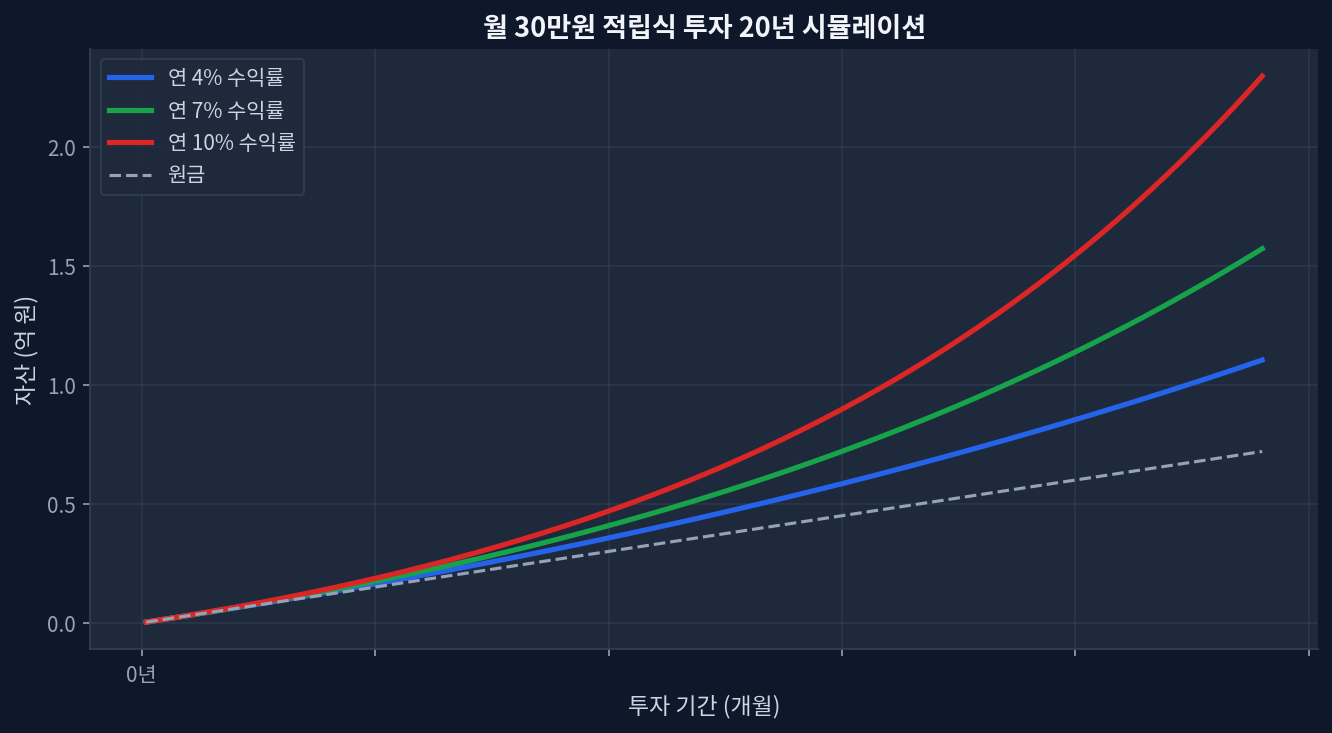
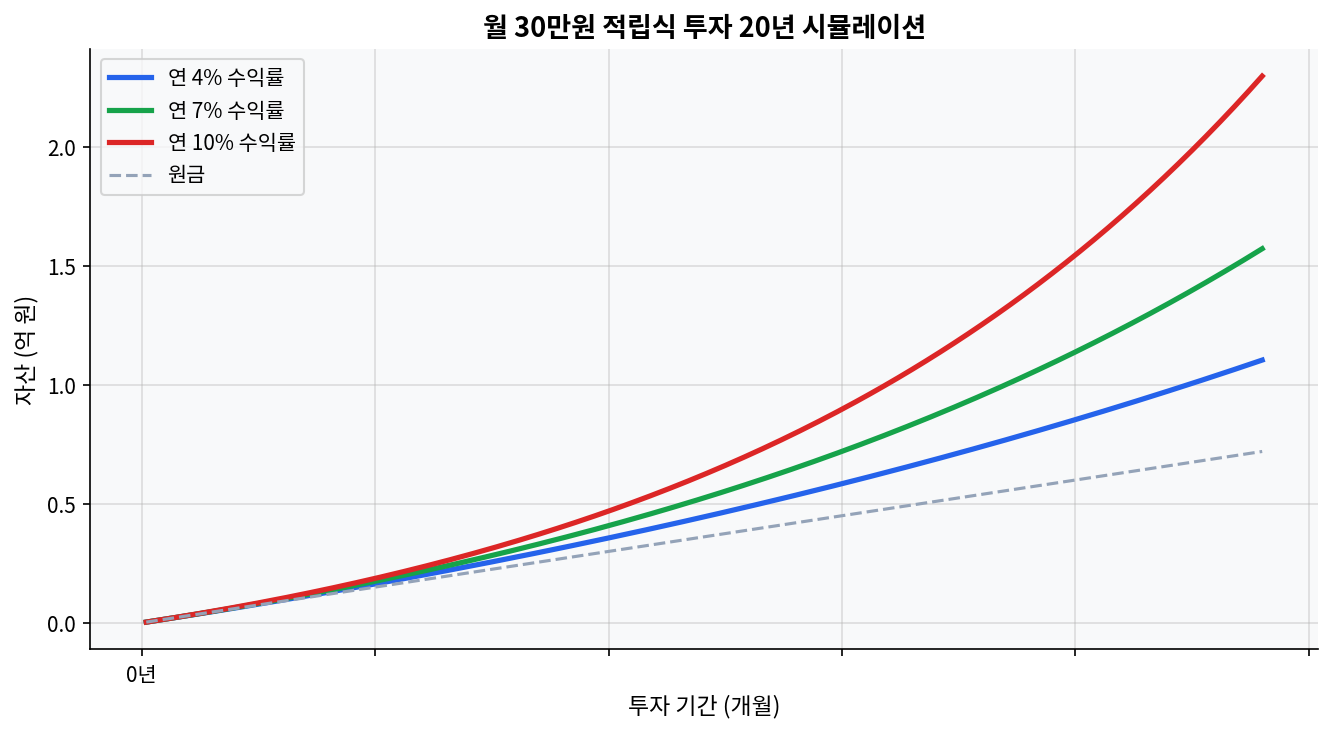
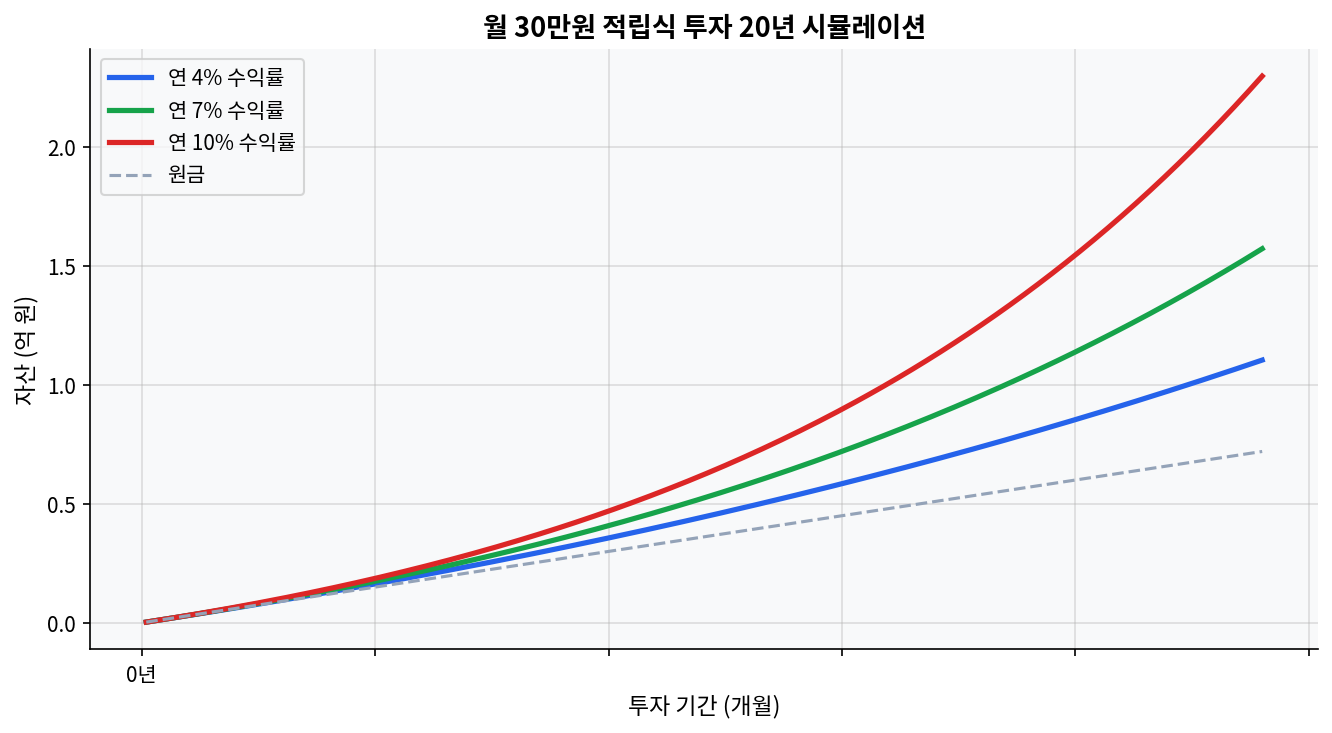
Upfront tax on Roth IRA contributions acts as a drag during prolonged market drawdowns, altering the break-even horizon. Traditional IRA deductions reinvested into taxable accounts can outperform Roth in bracket-compression scenarios. Asset location—placing VTI in Roth and BND in Traditional—adds approximately 40-60 bps of tax alpha annually. The 2020-2026 CAGR of US equities heavily skewed recent analyses toward Roth, hiding sequence-of-returns risks. The Core Mechanics of IRA Taxation Monthly $30K investment 20-year compound growth simulation The chart below shows a 20-year simulation of a $300 monthly investment (4%, 7%, and 10% annually). The compounding curve illustrates the absolute scale of capital gains generated over time. Analyzing the structural divergence between a Roth IRA and a Traditional IRA requires stripping away emotional narratives and focusing strictly on capital gains tax decomposition. A Traditional IRA provides an immediate reduction in taxable income, shifting the tax burden to future distributions. Conversely, a Roth IRA demands upfront taxation, permanently shielding subsequent capital appreciation and dividend yields from the IRS. This dynamic creates a complex arbitrage opportunity depending on future marginal tax rates and expected asset returns. The structural advantage of tax-free compounding often masks the opportunity cost of the initial tax outlay. [IRS.gov] ...
May 18, 2026 · InvestIQs Research
Korean Income Tax Filing Guide: The Dividend Threshold and IRP/ISA Tax Strategy

Korean Income Tax Filing Guide: The Dividend Threshold and IRP/ISA Tax Strategy

The statutory filing window for Korean comprehensive income tax runs from May 1 through May 31 of the following year, with weekends and public holidays rolling to the next business day. In 2026, May 31 falls on a Sunday, so filing and payment continue through June 1.Retirement account tax credits apply up to KRW 9 million, or about $6,500, at 15% for total compensation below KRW 55 million and 12% above that line. An IRP contribution of KRW 8.4 million, or about $6,100, can therefore generate a tax credit of KRW 1.26 million or KRW 1.008 million.When annual interest plus dividends exceed KRW 20 million, or about $14,500, the comprehensive taxation switch turns on. For US-listed ETFs such as VOO, SCHD, and DGRO, the account wrapper matters more than the ticker label.Failure-to-file penalties are 20%, underreporting penalties are 10%, and late-payment interest runs at 0.022% per day. Delay carries a measurable cost.Rolling ISA maturity proceeds into a retirement account can add 10% of the converted amount, up to KRW 3 million, or about $2,200, to retirement-account contribution creditable amounts. What the chart says first Monthly $30K investment 20-year compound growth simulation 20-year compound-growth simulation for a $220 monthly contribution The chart below shows how wide the gap becomes after 20 years when a $220 monthly contribution compounds at 4%, 7%, and 10%. In this range, compounding and contribution duration create larger numbers than tax optimization alone. Saving about $75 in tax may matter less than keeping the contribution schedule alive for one more year. ...

April 28, 2026
QQQ vs SPY 10-Year Regression: Tech Concentration vs Diversification

QQQ vs SPY 10-Year Regression: Tech Concentration vs Diversification

QQQ sits at $651.42 with a 1-year return of +44.0%, while SPY sits at $708.45 with a 1-year return of +33.8%.The 3-year cumulative gap is 30.2 percentage points: QQQ at +108.0% versus SPY at +77.8%.The 5-year cumulative gap is 15.4 percentage points: QQQ at +98.1% versus SPY at +82.7%.SPY still pays more income, with a 1.04% dividend yield versus QQQ at 0.43%, or 2.4 times as much cash yield.On an implied 5-year CAGR basis, QQQ is roughly 14.6% and SPY roughly 12.8%, which means the spread exists, but it is not huge enough to ignore regime risk. Why the 20-year savings curve matters more than the share price Monthly investment 20-year compound growth simulation The first mistake in comparing QQQ and SPY is to stare at the price tags. QQQ at $651.42 and SPY at $708.45 look like two expensive symbols, but share price is not the signal. The return path is. The 20-year monthly 300,000-won simulation inserted below this section makes the same point in a cleaner way: at 4%, 7%, and 10%, the ending values do not rise in a straight line. They accelerate. That is the compounding effect that turns a small annual edge into a large decade gap. ...

April 24, 2026