The Hidden Cost of 3x Leverage: QQQ vs TQQQ in a -30% Crash

The Hidden Cost of 3x Leverage: QQQ vs TQQQ in a -30% Crash

The Hidden Cost of 3x Leverage: QQQ vs [drawdown](/en/study/tqqq-five-year-<a href=)-and-volatility-decomposition-when-3x-trails-2x/">TQQQ in a -30% Crash QQQ delivered +40.7% over the past 12 months but now sits 96.4% within its 52-week range — near the top TQQQ's 3x leverage amplifies both gains and losses; in a -30% Nasdaq downturn, QQQ holders face -30% drawdown while TQQQ could lose -80% or more due to rebalancing drag Daily rebalancing in TQQQ introduces a "volatility tax" that erodes long-term returns, especially in sideways markets QQQ's P/E ratio of 34.0 reflects elevated valuation; TQQQ compounds this risk with leverage Scenario data shows a tech worker investing $1,500 monthly since 2020 faces asymmetric downside with leverage — protection requires hedging or cash reserves The Nasdaq has roared higher for most of 2024 and into 2025, with QQQ gains posting +40.7% over the past year. Yet that return masks an uncomfortable truth: the index now trades at a P/E ratio of 34.0, sits at 96.4% of its 52-week high, and leaves little room for error. For those tempted by the allure of leverage, the promise of 3x returns via TQQQ feels irresistible. But leverage works both ways, and the math of a -30% correction reveals why many leverage-chasing investors end up with catastrophic losses. ...
June 19, 2026 · InvestIQs Research
TQQQ’s 5-Year Drawdown and Volatility Breakdown: Where 3x Lagged 2x

TQQQ’s 5-Year Drawdown and Volatility Breakdown: Where 3x Lagged 2x

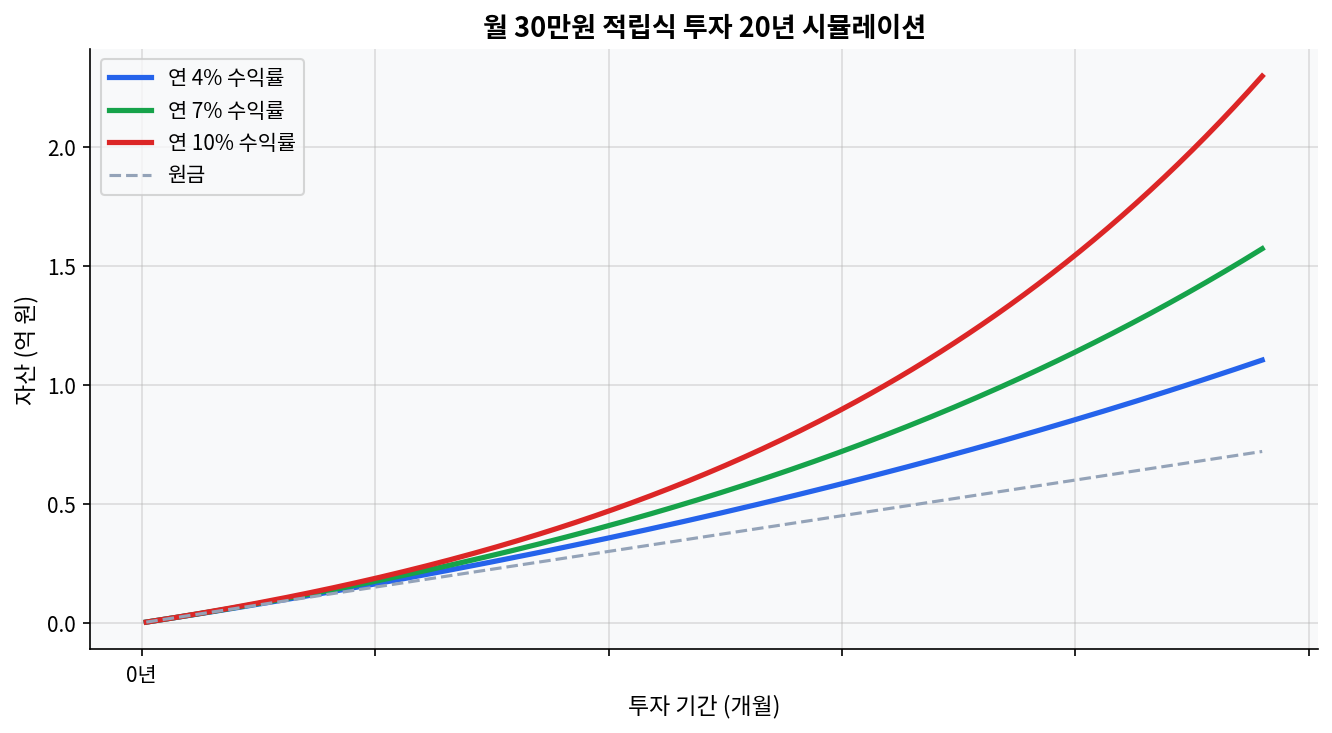
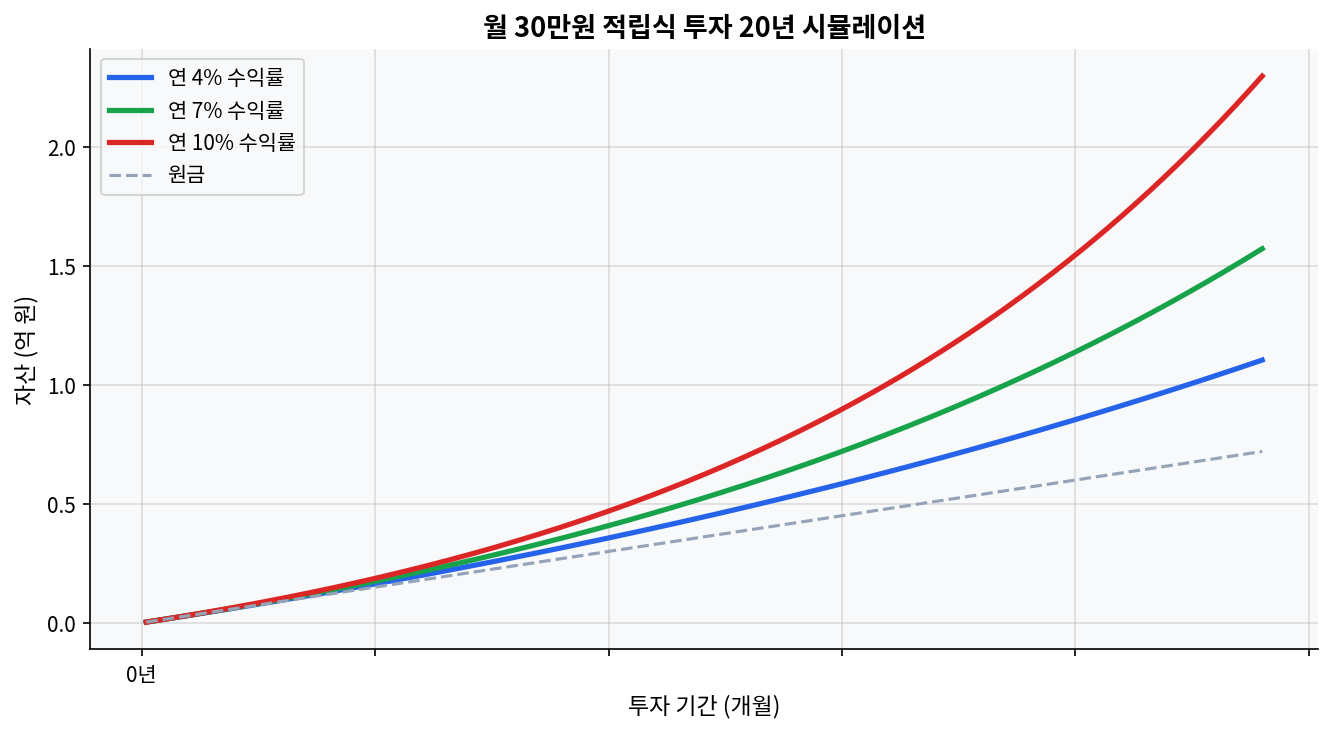
As of 2026-04-21, TQQQ’s five-year total return was 120.40%, with a CAGR of 16.57%.As of 2026-03-31, TQQQ’s five-year maximum drawdown was 81.65%, versus 35.12% for QQQ, or 2.33x deeper.Five-year annualized monthly volatility came in at 61.28% for TQQQ, 20.23% for QQQ, and 40.61% for QLD.Over the same five-year window, QLD outpaced TQQQ with a 137.48% total return and an 18.77% CAGR.Dividend yield was roughly 0.53% for TQQQ, 0.15% for QLD, and 0.43% for QQQ, which is why the real story in leveraged ETFs is path dependence, not cash flow. The Two Charts Say It First Monthly investment 20-year compound growth simulation Comparison of how ETF fee differences affect long-term wealth The first chart shows the 20-year wealth gap between a 0.05% ETF fee and a 1.0% fee. The second shows how monthly investing of $300 compounds very differently at 4%, 7%, and 10% over time. In a TQQQ discussion, those charts are not background material. For leveraged ETFs, costs and path shape the capital curve faster than the return table suggests. Even when TQQQ rallies hard between 2020 and 2026, the first question is how much damage a single 2022-style crash can do to the long-term line. ...

April 25, 2026
TQQQ Five-Year Drawdown and Volatility Decomposition: When 3x Trails 2x

TQQQ Five-Year Drawdown and Volatility Decomposition: When 3x Trails 2x

As of 2026-04-21, TQQQ’s 5-year total return was 120.40%, with a CAGR of 16.57%.As of 2026-03-31, TQQQ’s 5-year maximum drawdown was 81.65%, compared with 35.12% for QQQ.5-year annualized monthly volatility was 61.28% for TQQQ, 20.23% for QQQ, and 40.61% for QLD.Over the same 5-year window, QLD outperformed TQQQ with a total return of 137.48% and a CAGR of 18.77%.Dividend yield sat at 0.53% for TQQQ, 0.15% for QLD, and 0.43% for QQQ. For leveraged ETFs, the core driver is not cash flow but path dependency. The Two Charts Say the First Thing Comparison of how ETF fee differences affect long-term returns The first chart shows the long-run asset gap between 0.05% and 1.0% ETF fees over 20 years. The second shows how monthly $300 contributions diverge over time at 4%, 7%, and 10% annual returns. In the TQQQ discussion, those two charts are not background noise. For leveraged ETFs, cost and path shape the equity curve faster than the headline return table suggests. Even if TQQQ posts a strong 2020-2026 run, a single 2022-style collapse can damage the long-run profile in ways that are hard to reverse. ...

April 24, 2026