TLT's Volatility Trap: Why Rate Cuts Don't Automatically Fix Bond Losses

TLT's Volatility Trap: Why Rate Cuts Don't Automatically Fix Bond Losses

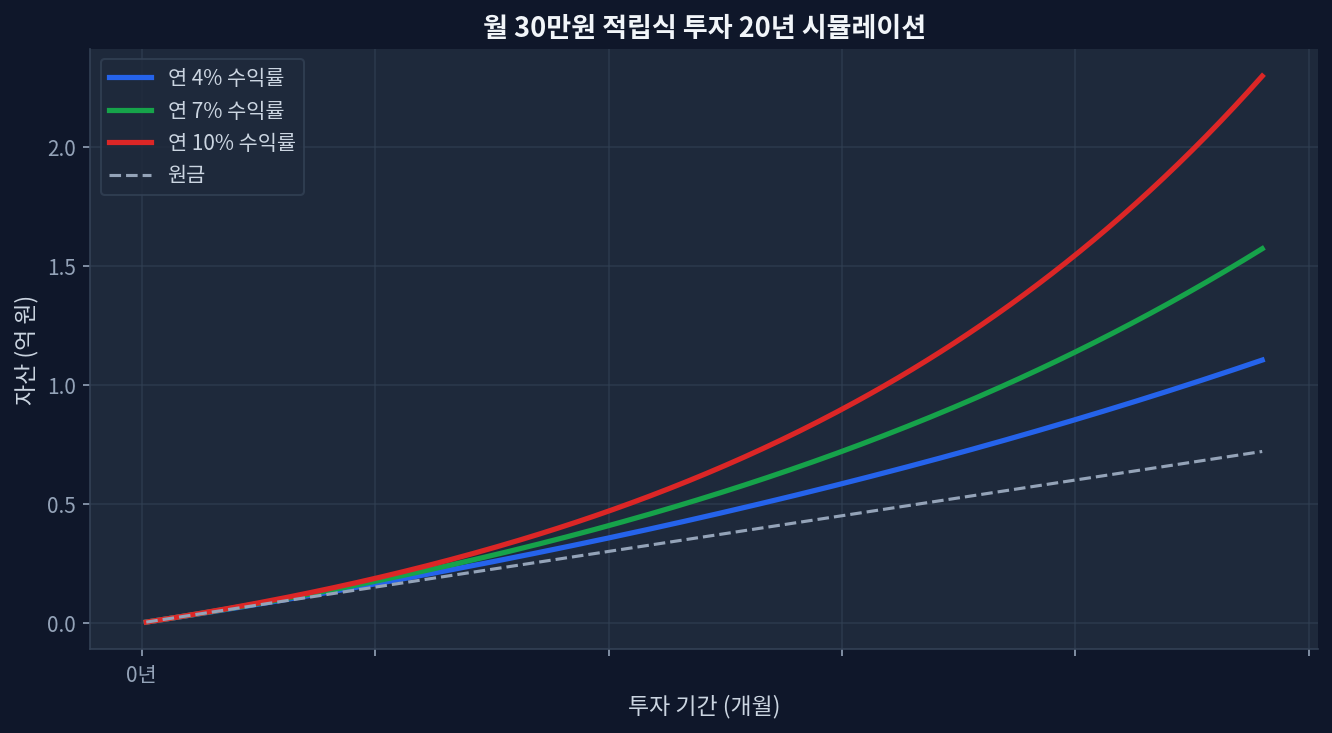
5-year drawdown: TLT down 27.8% from 2021 peak, despite conventional wisdom on duration bondsCurrent yield: 4.55% AUM-weighted, trading at $86.09 (52-week low near $82.77)The catch: A hypothetical 1% rate cut would reverse ~$4–5 per share, but volatility-decoded-why-284-loss-masks-a-15-rebound-case/">duration risk remains asymmetric—further rate hikes could erase gains fasterDollar-cost averaging reality: Monthly $1,500 allocations into TLT since 2020 experienced negative real returns despite consistent depositsDisconfirming scenario: If inflation stays sticky and the Fed pauses rate cuts, TLT holders face extended capital losses even with elevated yields The 27.8% Question: Why Long-Duration Bonds Got Decimated Monthly $30K investment 20-year compound growth simulation TLT—the iShares 20+ Year Treasury Bond ETF—has become shorthand for “bond market catastrophe” among retail investors. The numbers don’t lie. Over the past five years (2021–2026), TLT shed 27.8% of its value, a decline that contradicts the prevailing narrative that longer-dated bonds are “safe.”[yfinance] The culprit: the fastest rate-hiking cycle in 40 years. When the Federal Reserve raised the overnight rate from 0% to 5.25%–5.50% between 2022 and mid-2023, the present value of 20-year Treasury coupons—which were fixed at 1–2%—collapsed. ...
June 23, 2026 · InvestIQs Research
TLT Volatility Decoded: Why -28.4% Loss Masks a 15% Rebound Case

TLT Volatility Decoded: Why -28.4% Loss Masks a 15% Rebound Case

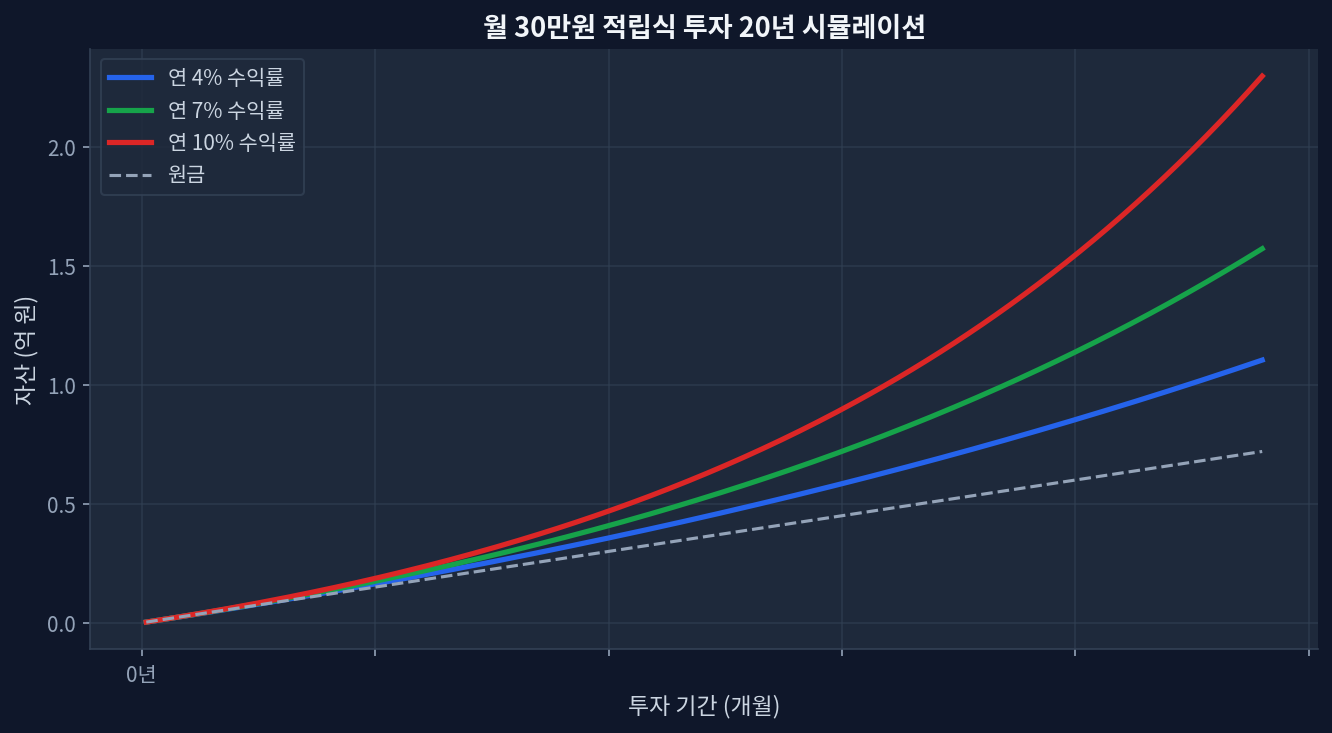
TLT (Vanguard Extended-Term Treasury ETF) delivered -28.4% over 5 years but +5.5% in the last 12 months as rate expectations shifted lowerCurrent price of $86.19 sits at just 36.3% of the 52-week range ($82.77–$92.19), signaling capitulation and limited downside risk4.54% current dividend yield[Yahoo Finance] covers opportunity cost during extended flat-rate periodsDuration math: each 100 basis points of rate decline adds ~8–12% to principal—a 150bps cut cycle targets $94–$97 per shareRisk: inflation resurges or Fed pivots hawkish, trapping investors in yield-on-cost mode with no capital recovery The Hidden Mechanics: Why Long-Duration Bonds Crater Faster Than Equities in Rising Rates volatility-decoded-why-284-loss-masks-a-15-rebound-case/compound-growth.png" alt="Monthly $30K investment 20-year compound growth simulation" loading="lazy" style="max-width:100%;border-radius:8px;">Monthly $30K investment 20-year compound growth simulation Bond mathematics are unforgiving. A bond’s duration measures its sensitivity to rate moves in years: a 15-year duration bond loses 15% for every 1% rise in yields. TLT, tracking 20-year Treasury bonds, carries a duration of roughly 15–16 years. When the Federal Reserve hiked from 0% to 5.5% (March 2022 through July 2023), and the 20-year yield climbed from 1.9% to 4.2%+, TLT’s net asset value collapsed by nearly 30%. ...

June 17, 2026 · InvestIQs Research
TLT & REITs 6:4 Portfolio: Income and Diversification in a High-Rate Environment

TLT & REITs 6:4 Portfolio: Income and Diversification in a High-Rate Environment

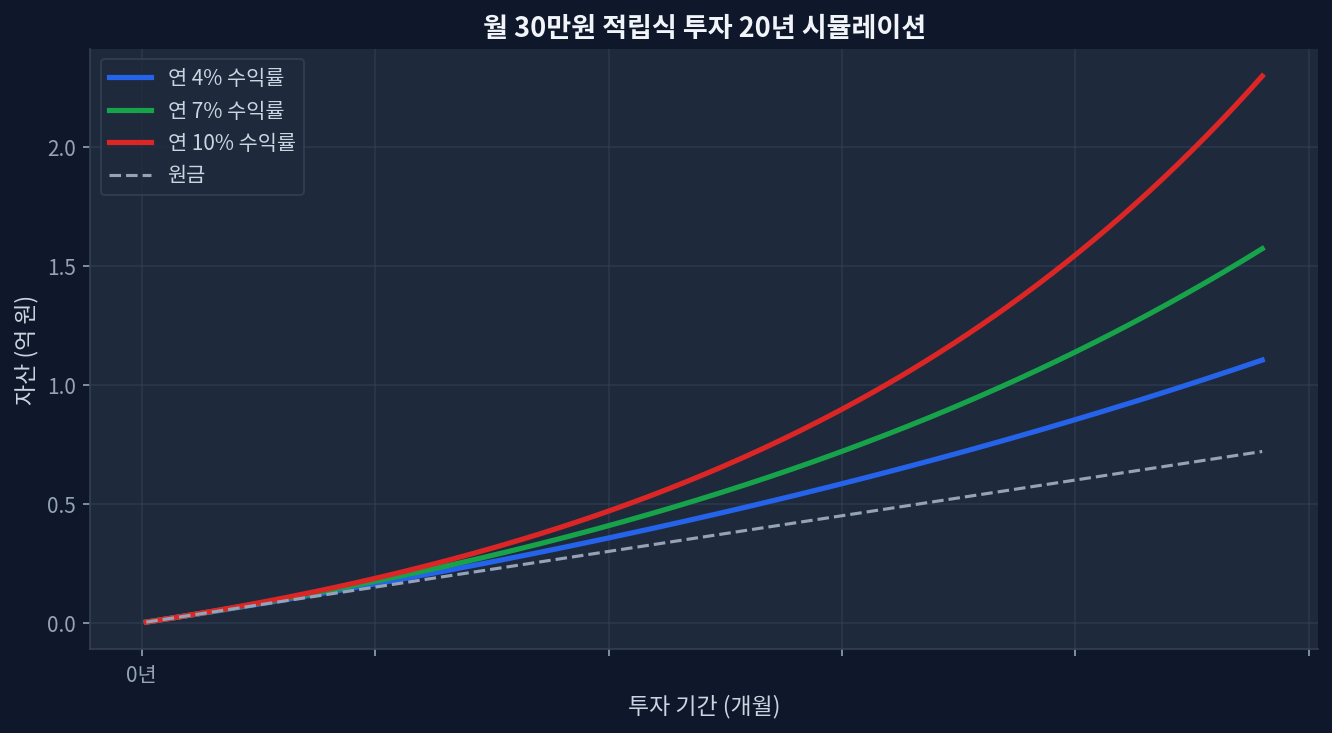
TLT current yield: 4.55% with $42.9B in AUM; down 27.7% over 5 years but up 2.9% in the past yearA 6:4 TLT-to-REIT allocation targets ~5.5% blended yield while reducing duration risk through equity diversificationTLT's 52-week range ($82.77–$92.19) suggests room for tactical entry at lower valuationsREIT liquidity and leverage complicate the comparison; higher nominal yields often hide higher volatilityInterest-rate risk remains the dominant constraint: further rate hikes would pressure TLT NAV and REIT cap rates simultaneously Why a 6:4 Bond-to-REIT Split Works (and Why It Doesn’t) Monthly $30K investment 20-year compound growth simulation The Treasury bond market has been brutal for nearly a decade. The Invesco QQQ Trust (QQQ) outpaced the iShares 20+ Year Treasury ETF (TLT) by over 50 percentage points between 2015 and 2023. Yet in 2024–2026, as rate-cut expectations wavered and macro uncertainty persisted, bond allocations have found surprising utility in portfolios that needed predictable cash flow without equity volatility. ...

June 15, 2026 · InvestIQs Research
Maximizing Yield Through 2022 Drawdown Recovery Speed Analysis: VOO, BND, TLT, GLD

Maximizing Yield Through 2022 Drawdown Recovery Speed Analysis: VOO, BND, TLT, GLD

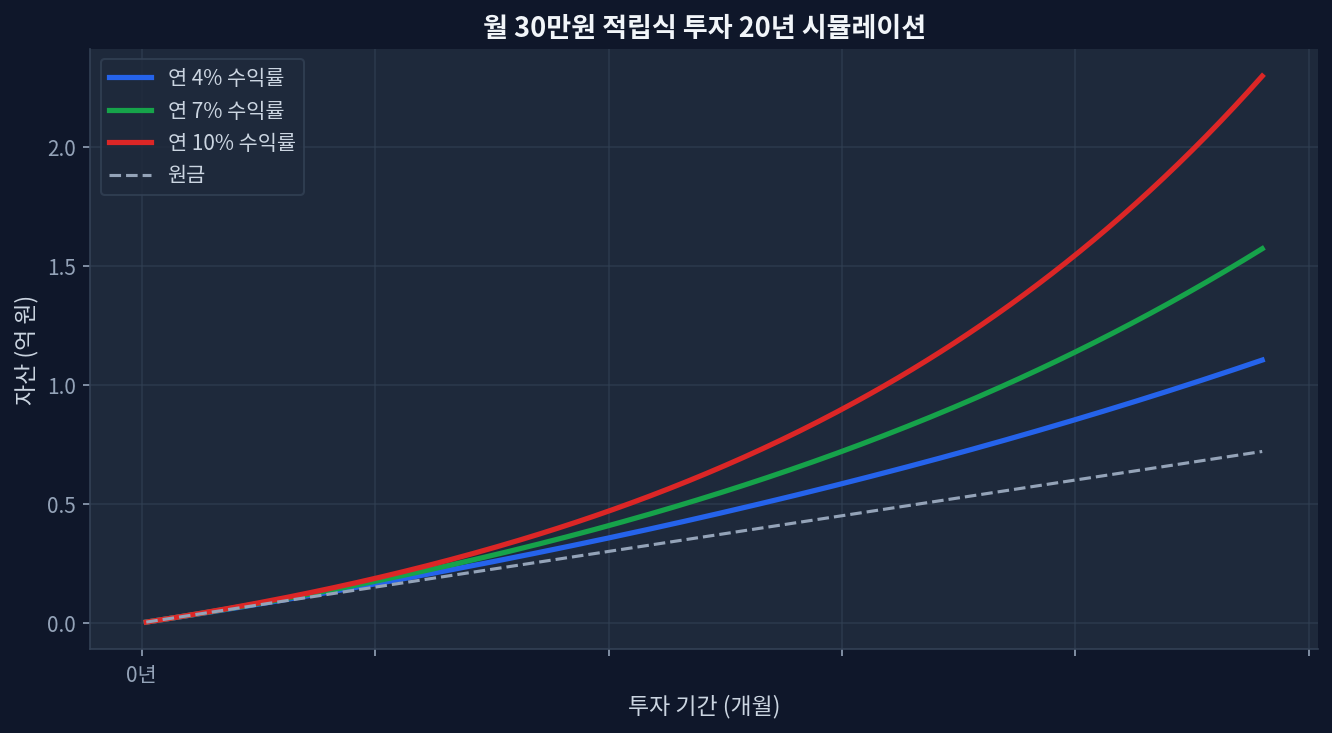
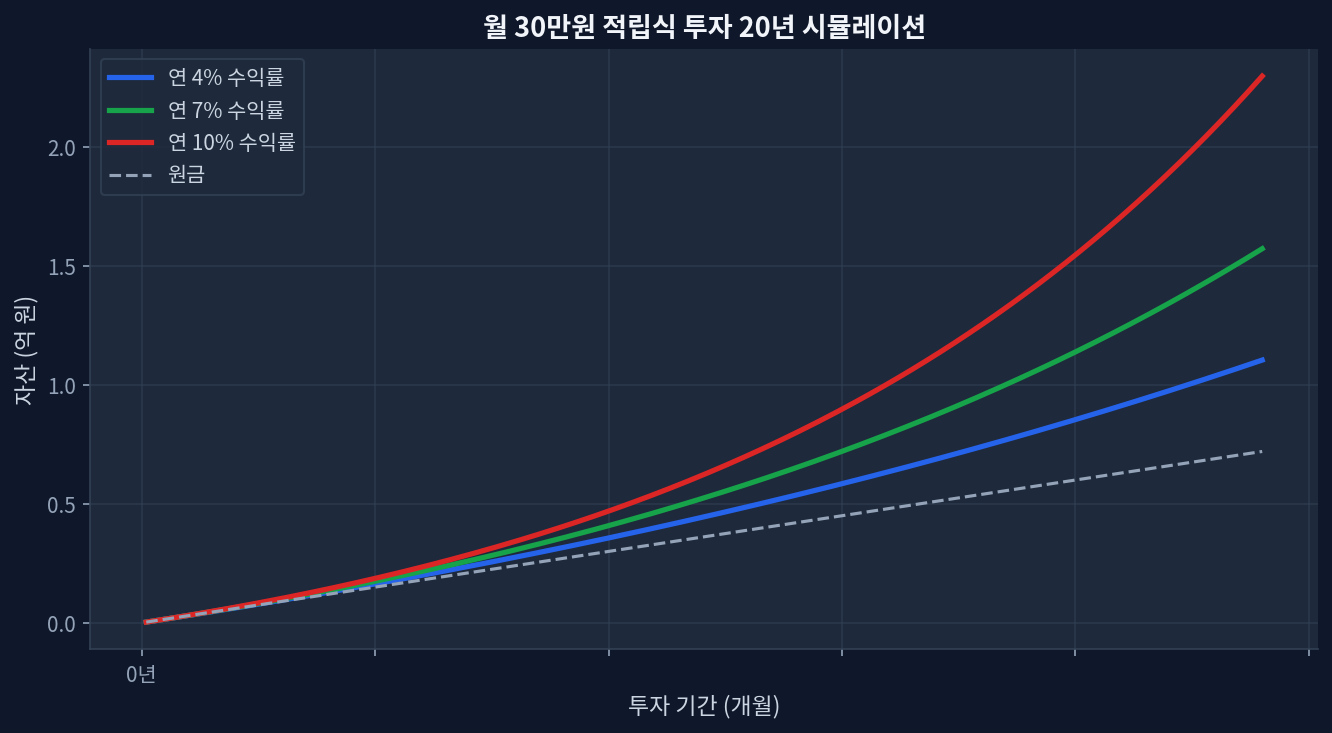
TLT continues to struggle with a 5-year return of -27.3% and a 3-year return of -7.2%, despite offering a 4.57% dividend yield.BND shows resilience with a +5.5% 1-year return and a +11.3% 3-year return, yielding 3.93%.GLD exhibits explosive growth, trading at $416.99 with a massive +138.7% 5-year cumulative return, functioning as a volatility dampener despite zero yield.Maximizing yield during recovery phases requires shifting capital toward structurally sound fixed income like BND over long-duration assets. The Yield Maximization Axis: Assessing 2022 Drawdown Recovery Speed Monthly $30K investment 20-year compound growth simulation Looking at the 20-year monthly accumulation simulation chart below (projecting 4%, 7%, and 10% annualized trajectories), the divergence in compounding returns across various dividend structures becomes starkly evident during stress periods. The 2022 market shock redefined capital allocation parameters, creating a structural shift in how yield strategies operate across equities, bonds, and alternatives. Real-time data exposes the persistent lag in long-duration Treasuries. TLT currently trades at $84.22 with a 1-year return of +4.9%, yet the 5-year cumulative return remains severely compressed at -27.3%[Yahoo Finance]. Conversely, intermediate bonds have re-established stability. BND recorded a 1-year return of +5.5% and a robust +11.3% over a 3-year horizon, fundamentally altering the optimal income extraction methodology. ...

May 22, 2026 · InvestIQs Research
Rethinking the 60/40 Portfolio: A 10-Year BND vs. TLT Allocation Analysis

Rethinking the 60/40 Portfolio: A 10-Year BND vs. TLT Allocation Analysis

The classic 60/40 portfolio faces secular headwinds, highlighted by BND's stagnant 5-year return of +0.0%. TLT's deep -27.8% 5-year drawdown challenges the assumption that long-duration bonds always hedge equity risk. Current yield profiles (BND at 3.93%, TLT at 4.57%) present a yield-versus-duration risk tradeoff. Rebalancing strategies must account for the high correlation observed between stocks and bonds since 2022. The Stagnation of the 60/40 Portfolio: A 10-Year Bond Data Analysis Monthly $30K investment 20-year compound growth simulation Looking at the automated chart below representing a 20-year monthly $300 investment simulation at 4%, 7%, and 10% annual yields, the compounding effect is profound. However, this growth assumes consistent positive nominal returns, an assumption severely tested by recent bond market behavior. The traditional 60/40 portfolio—allocating 60% to equities and 40% to fixed income—has long relied on bonds to provide a steady ballast. Yet, analyzing the 10-year data through the lens of dominant bond ETFs reveals structural vulnerabilities. ...

May 20, 2026 · InvestIQs Research