KODEX 200 vs TIGER 200: How 0.01% Fee Gap Compounds Over Five Years
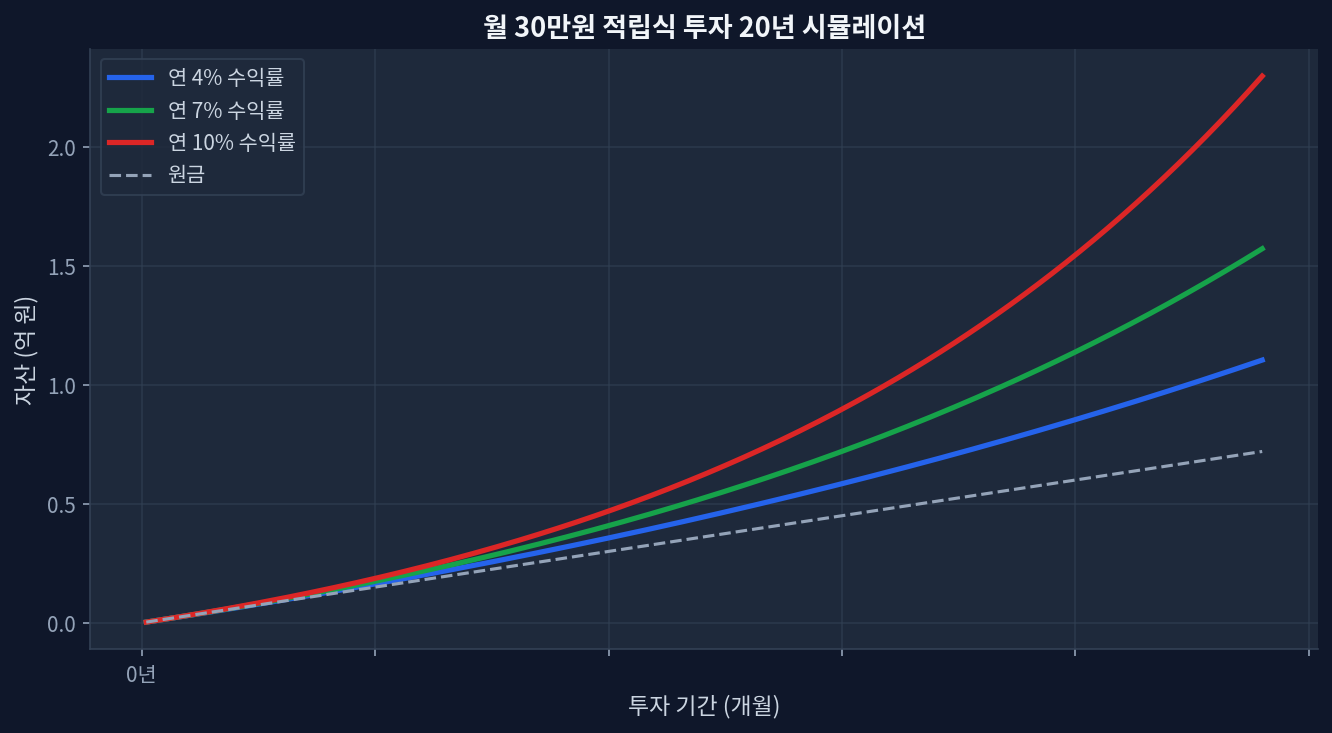
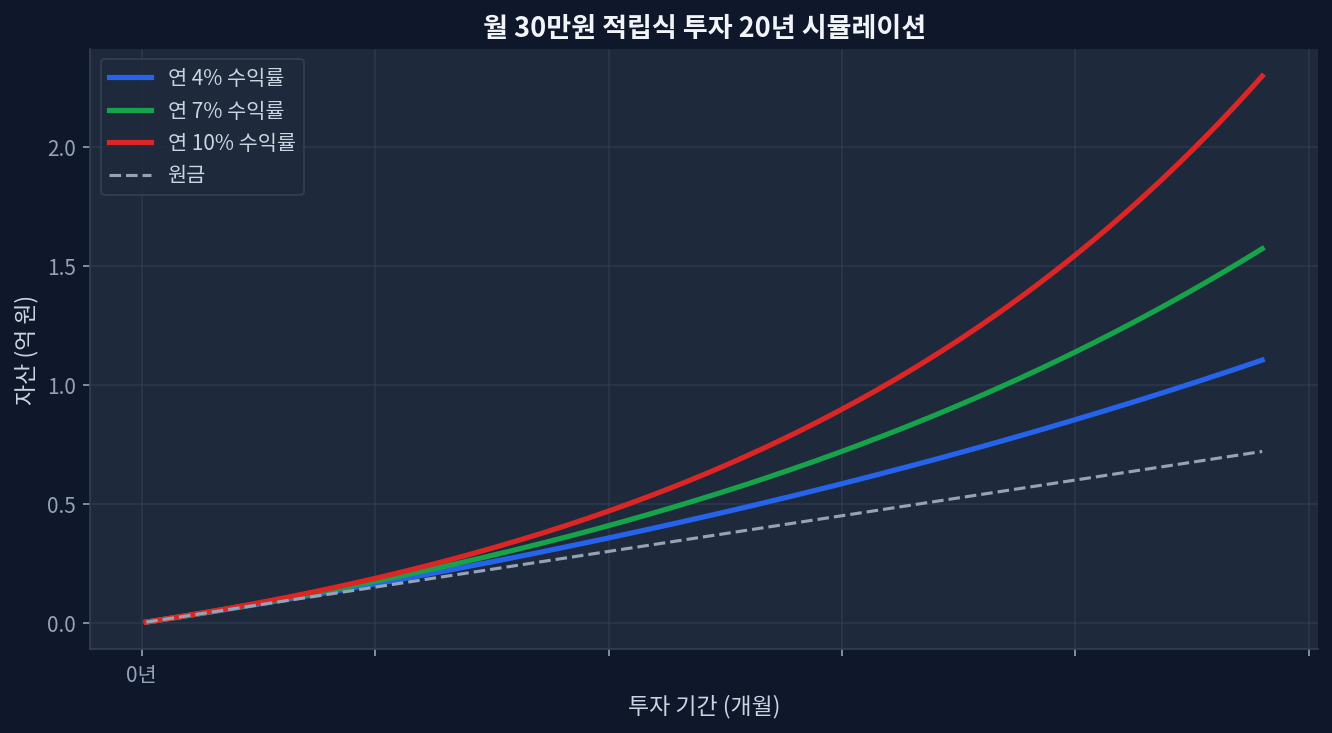
KODEX 200 and TIGER 200 track the same KOSPI 200 index with negligible fee difference (~0.01%)Monthly $1,500 investment over 5 years compounds to roughly $126,000, yet fee drag difference totals only $50–$150 in absolute dollarsFor Korean retail investors with $500k+, fee efficiency starts mattering; below that threshold, trading costs and entry timing dominateUS investors face hidden FX spreads (0.5–1.5%) and custody fees that dwarf any 0.01% fee gap entirely—a critical disconfirming factorData from official ETF prospectuses and yfinance; exact fee impact depends on entry timing, rebalancing frequency, and account size Two ETFs, One Index, One Micro-Difference Monthly $30K investment 20-year compound growth simulation KODEX 200 and TIGER 200 are South Korean equity ETFs, both engineered to track the KOSPI 200 index[ETF.com Reference]. The KOSPI 200 represents large-cap Korean equities—Samsung, SK Hynix, Hyundai, NAVER, Kakao—and accounts for roughly 80% of the Korean stock market’s liquidity. Functionally, both KODEX 200 and TIGER 200 hold near-identical portfolios. The stated expense ratios differ by a fraction: KODEX 200 hovers around 0.08% annually, while TIGER 200 sits at roughly 0.07%[Morningstar ETF Data]. That 0.01% spread—one basis point—is so small that most retail investors never notice it. Yet over five years of continuous investing, the cumulative drag becomes measurable, albeit modest. ...