SCHD Quarterly Dividend Cut 2.7%, Yet 3.25% Yield Persists: Why the Ma

SCHD Quarterly Dividend Cut 2.7%, Yet 3.25% Yield Persists: Why the Ma

SCHD Quarterly Dividend Cut 2.7%, Yet 3.25% Yield Persists: Why the Market Narrative Misses the Point Monthly $30K investment 20-year compound growth simulation SCHD quarterly dividend: $0.2530, down 2.7% year-over-year Dividend yield: Still 3.25% — 2.2x higher than VIG at 1.47% One-year total return: +26.5% (dividend plus capital appreciation) Current valuation: P/E 18.8, moderate territory, currently trading 85.7% into the 52-week range Assets under management: $94.9B — scale that underpins distribution stability Dividend Cut, Yet Surprisingly Resilient Schwab US Dividend Equity ETF (SCHD) announced a quarterly distribution of $0.2530—down 2.7% from the same period last year at $0.2600. On the surface, a contraction in cash flow. Dividend was trimmed, so the narrative should be negative. ...
July 1, 2026 · InvestIQs Research
20-Year DRIP Reinvestment Simulation: Risk Data vs. Consensus Assumptions

20-Year DRIP Reinvestment Simulation: Risk Data vs. Consensus Assumptions

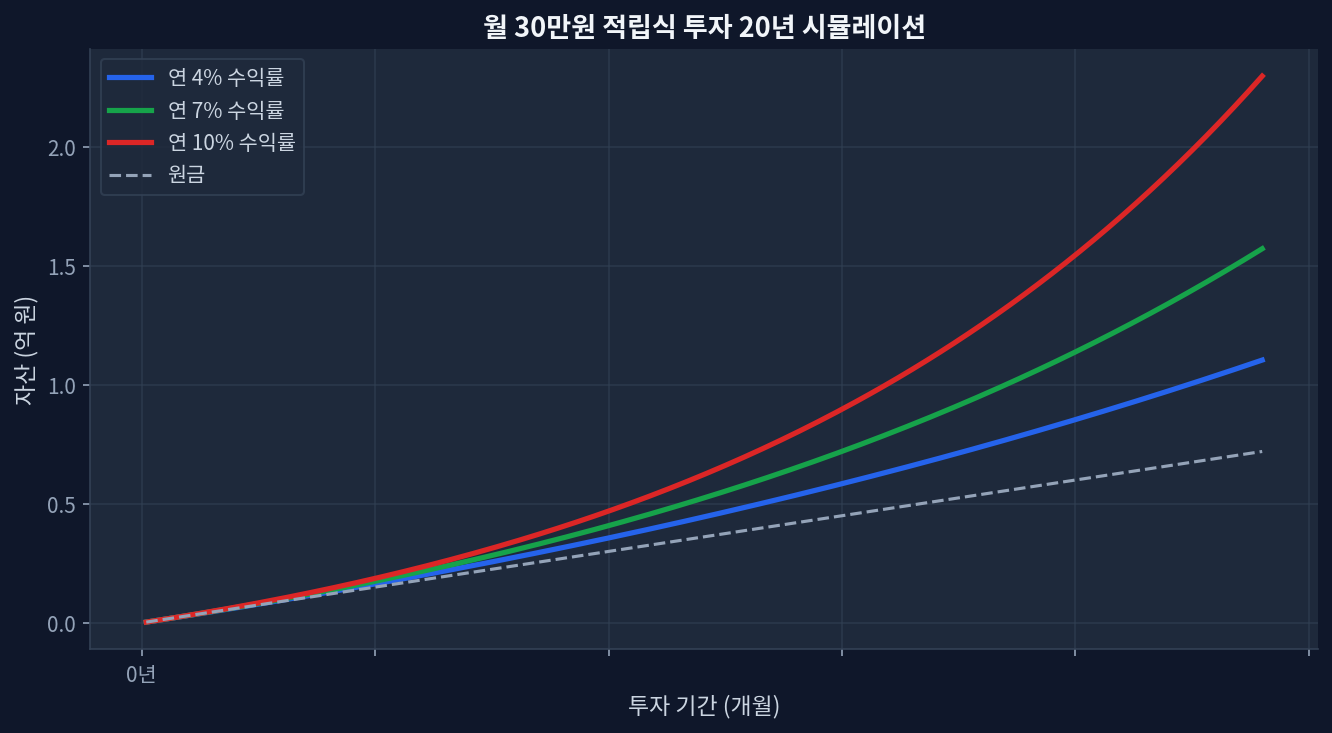
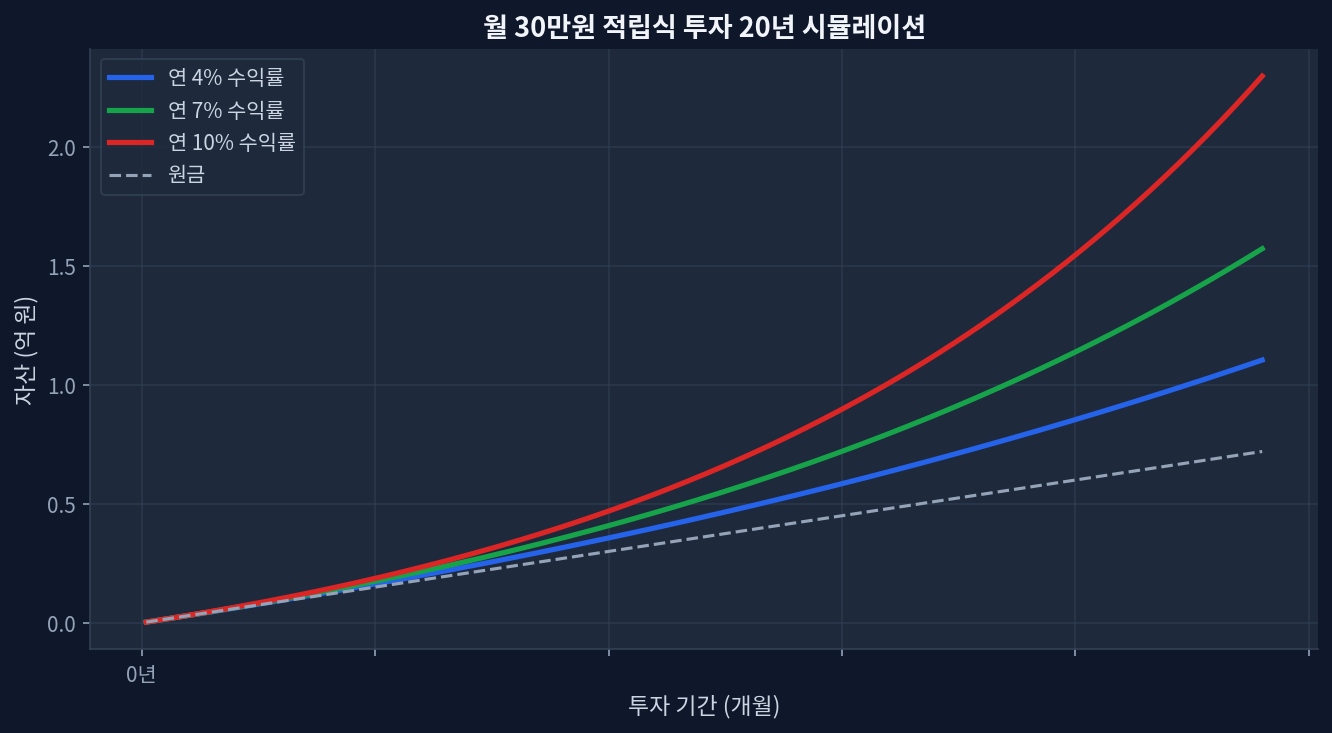
$1,500/month at 7% DRIP CAGR over 20 years = ~$782K; at 4%, ~$550K — a $232K gap driven entirely by the assumed return rateEvery 1% shift in assumed return adds or removes ~$110K–$130K in terminal value at year 20; sensitivity is nonlinearTax drag in taxable accounts reduces effective reinvestment yield by 15–25%; account type is a primary, not secondary, variable2020 S&P dividend cuts (~14% aggregate quarterly reduction) pushed realized DRIP rates 200bps below model assumptions for high-yield ETFsDRIP reinvestors during the Q1 2020 drawdown outperformed non-reinvestors by 12–18% by year-end — a volatility effect flat-line models ignore entirely What the 20-Year Simulation Data Actually Shows Monthly $30K investment 20-year compound growth simulation Running $1,500/month at 4%, 7%, and 10% for 20 years produces a divergence that widens sharply in the back half of the period. At year 10, the gap between the 4% and 10% paths is roughly $200K. By year 20, that gap exceeds $590K. The simulation chart above captures the inflection clearly: the 10% curve breaks away from the 4% path around year 12, when accumulated DRIP dividends begin compounding on themselves at scale.[FRED] ...

May 17, 2026 · InvestIQs Research