Tax-Optimized SPY Growth: Building $500K Over 20 Years

Tax-Optimized SPY Growth: Building $500K Over 20 Years

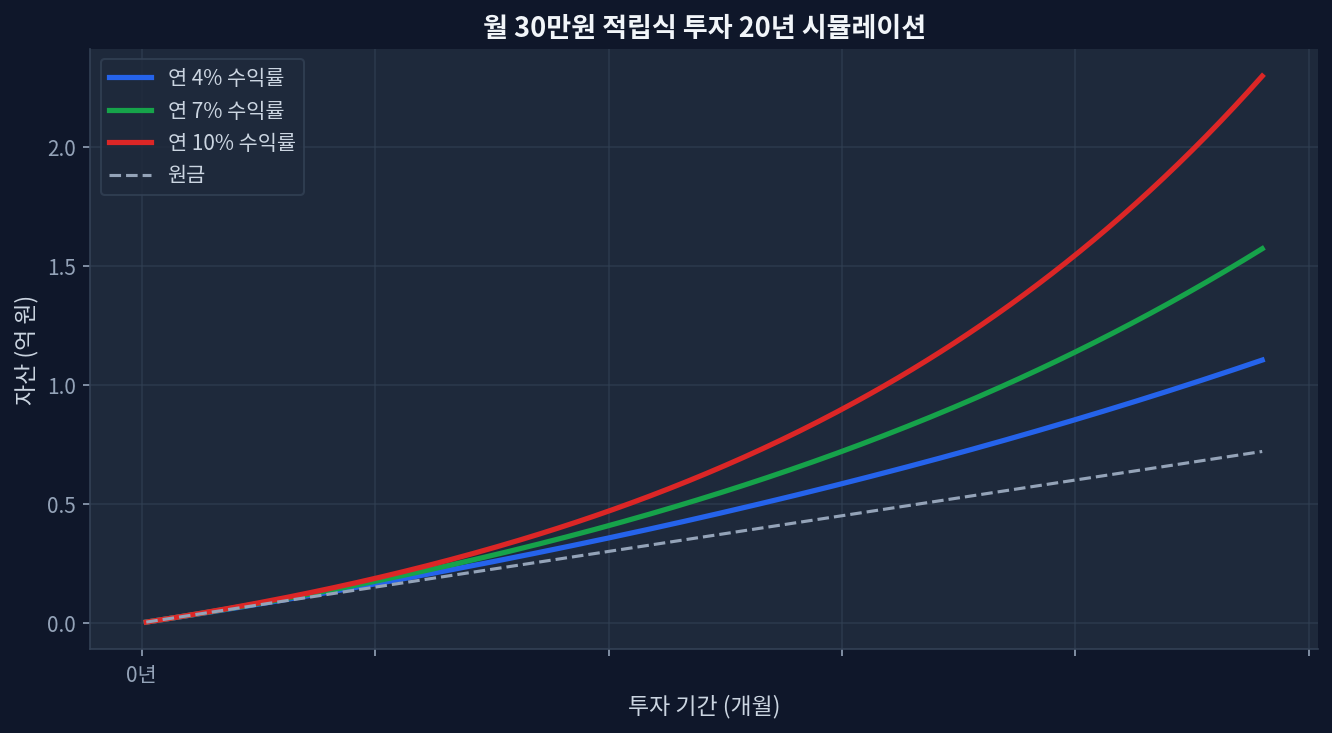
Key Takeaways$500/month SPY investment reaches $495K–$560K after 20 years (7–10% annual returns, depending on tax scenario)Tax-advantaged accounts compound ~$100K–$150K more wealth than taxable accounts due to deferred or eliminated taxesDividend tax drag: SPY's 1.0% yield generates ~$7,400 in taxable income annually in year 20 (if held in taxable brokerage)Long-term capital gains rate: 15–20% federal (depending on income bracket), plus 0–13% state taxValuation risk: SPY's P/E of 26.5 is historically elevated; 5–8% returns more realistic than past decade's 25%+ returns Why Tax Strategy Trumps Fund Selection in Long-Term Wealth Building Monthly $30K investment 20-year compound growth simulation Most investors focus on beating the market or picking the right fund. They miss a bigger opportunity: minimizing taxes. Consider this: a portfolio growing at 9% annually in a taxable account effectively grows at 6.5–7% after taxes (assuming 25% blended tax rate on dividends and capital gains). The same portfolio in a Roth IRA grows at the full 9% tax-free. ...
June 18, 2026 · InvestIQs Research

June 18, 2026 US Market Close: S&P 500 $740.96 -1.25%, Nasdaq -1.01%

⚠️ Daily market snapshot — informational only This article summarizes publicly available yfinance data. It is not investment advice and does not recommend buying or selling any security. All investment decisions and outcomes are your own responsibility. 🧭 Market Sentiment: Neutral 😐 (53/100) █████░░░░░ Estimated from VIX 18.44 📊 Market Breadth · 🔴 sectors 0/11 advancing (0%) · 🔴 Mag7 0/7 advancing (0%) Summary: S&P 500 $740.96 -1.25%, Nasdaq -1.01%, VIX 18.44. Leaders: XLI, XLK, XLF / Laggards: XLC, XLY, XLRE. ...

June 18, 2026 · InvestIQs Editorial

June 17, 2026 US Market Close: S&P 500 $750.33 -0.60%, Nasdaq -1.90%

⚠️ Daily market snapshot — informational only This article summarizes publicly available yfinance data. It is not investment advice and does not recommend buying or selling any security. All investment decisions and outcomes are your own responsibility. 🧭 Market Sentiment: Neutral 😐 (54/100) █████░░░░░ Estimated from VIX 16.41 📊 Market Breadth · 🟢 sectors 8/11 advancing (73%) · 🟡 Mag7 3/7 advancing (43%) Summary: S&P 500 $750.33 -0.60%, Nasdaq -1.90%, VIX 16.41. Leaders: XLF, XLU, XLI / Laggards: XLK, XLE, XLY. ...

June 17, 2026 · InvestIQs Editorial
VOO vs SPY: How a 0.03% Fee Difference Compounds Over 10 Years

VOO vs SPY: How a 0.03% Fee Difference Compounds Over 10 Years

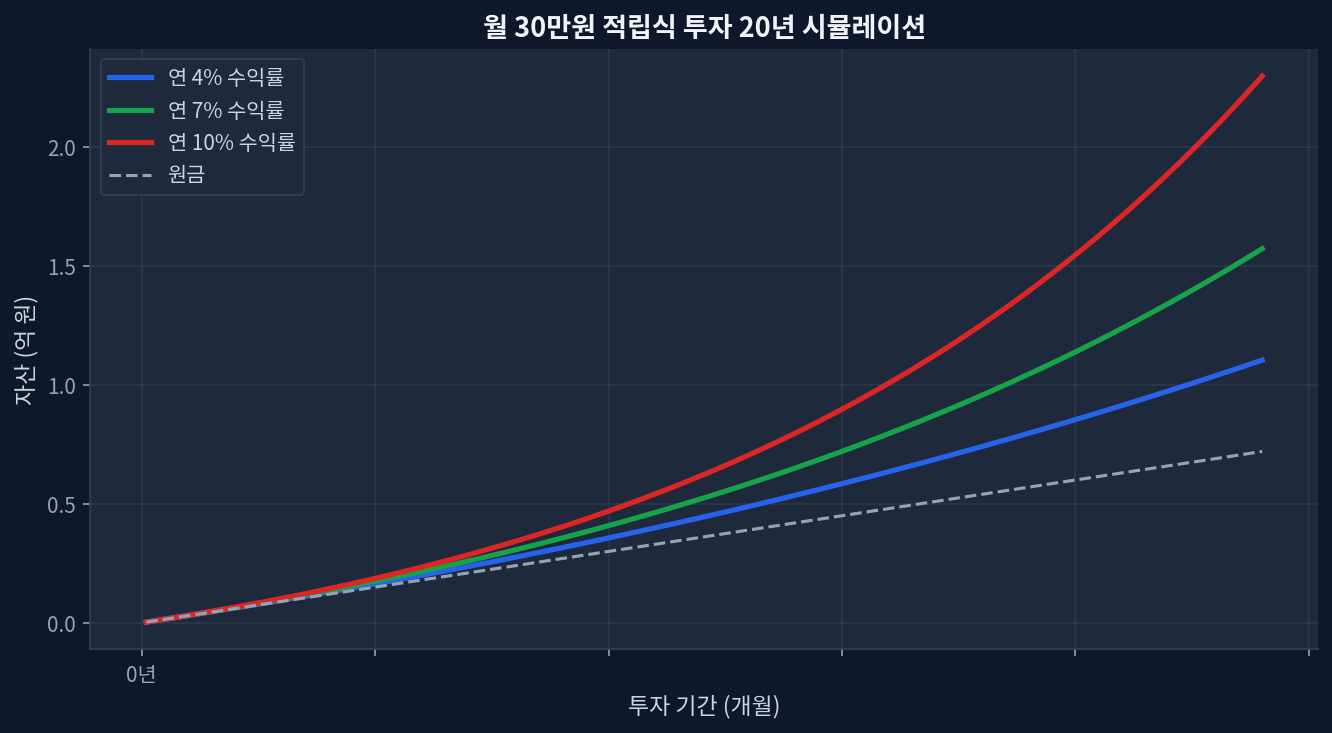
VOO's 0.03% expense ratio vs SPY's 0.09%: 0.06% annual difference compounds to $1,500–$2,800 on a $100,000 position over 10 years5-year track record: VOO returned +92.2%, SPY returned +91.7%—a 0.5% gap partly explained by fee dragDividend yield split: VOO 1.03% vs SPY 0.98% (0.05% edge) further narrows the take-home differenceScale matters: VOO's $1.7T AUM vs SPY's $783.8B means tighter bid-ask spreads and more stable trackingContrarian risk: Fee savings can evaporate if VOO experiences tracking error, net fund outflows, or structural changes to Vanguard's modelThe Fee Debate That Actually Moves Money Monthly $30K investment 20-year compound growth simulation Investors hear the phrase "0.03% vs 0.09%" and nod. They hear "penny-pinching" and move on. But the arithmetic is deceptive. Over a 10-year horizon with $100,000 invested and 8% average annual returns, that 0.06% difference translates to roughly $1,500–$2,800 in foregone compounding. Double the initial capital and the gap widens to $3,000–$5,600. This is not noise; it is structural leakage from your portfolio. ...

June 16, 2026 · InvestIQs Research

June 16, 2026 US Market Close: S&P 500 $754.83 +1.76%, Nasdaq +3.14%

⚠️ Daily market snapshot — informational only This article summarizes publicly available yfinance data. It is not investment advice and does not recommend buying or selling any security. All investment decisions and outcomes are your own responsibility. 🧭 Market Sentiment: Greed 😊 (58/100) ██████░░░░ Estimated from VIX 16.20 📊 Market Breadth · 🟢 sectors 7/11 advancing (64%) · 🟢 Mag7 7/7 advancing (100%) Summary: S&P 500 $754.83 +1.76%, Nasdaq +3.14%, VIX 16.20. Leaders: XLK, XLY, XLI / Laggards: XLE, XLRE, XLV. ...

June 16, 2026 · InvestIQs Editorial

June 15, 2026 US Market Close: S&P 500 $741.75 +0.54%, Nasdaq +0.59%

⚠️ Daily market snapshot — informational only This article summarizes publicly available yfinance data. It is not investment advice and does not recommend buying or selling any security. All investment decisions and outcomes are your own responsibility. 🧭 Market Sentiment: Greed 😊 (56/100) ██████░░░░ Estimated from VIX 17.68 📊 Market Breadth · 🟢 sectors 9/11 advancing (82%) · 🟡 Mag7 4/7 advancing (57%) Summary: S&P 500 $741.75 +0.54%, Nasdaq +0.59%, VIX 17.68. Leaders: XLB, XLF, XLU / Laggards: XLC, XLV, XLY. ...

June 15, 2026 · InvestIQs Editorial

June 14, 2026 US Market Close: S&P 500 $741.75 +0.54%, Nasdaq +0.59%

⚠️ Daily market snapshot — informational only This article summarizes publicly available yfinance data. It is not investment advice and does not recommend buying or selling any security. All investment decisions and outcomes are your own responsibility. 🧭 Market Sentiment: Greed 😊 (56/100) ██████░░░░ Estimated from VIX 17.68 📊 Market Breadth · 🟢 sectors 9/11 advancing (82%) · 🟡 Mag7 4/7 advancing (57%) Summary: S&P 500 $741.75 +0.54%, Nasdaq +0.59%, VIX 17.68. Leaders: XLB, XLF, XLU / Laggards: XLC, XLV, XLY. ...

June 14, 2026 · InvestIQs Editorial

VOO vs SPY — ETF Comparison

VOO vs SPY: Key Differences VOO and SPY both track the S&P 500 and hold virtually identical portfolios. The key practical difference is the expense ratio: VOO charges 0.03%, while SPY charges 0.0945%. ...

June 14, 2026 · InvestIQs Editorial

2026년 6월 2주차 (6월 8일~12일) US Market Weekly Wrap: S&P 500 -0.22%, Nasdaq +0.49%

⚠️ Daily market snapshot — informational only This article summarizes publicly available yfinance data. It is not investment advice and does not recommend buying or selling any security. All investment decisions and outcomes are your own responsibility. 🧭 Market Sentiment: Neutral 😐 (55/100) ██████░░░░ Estimated from VIX 0.00 Summary: S&P 500 -0.22%, Nasdaq +0.49%, VIX 17.68. Leaders: XLP, XLB, XLF / Laggards: XLE, XLK, XLC. ...

June 13, 2026 · InvestIQs Editorial

June 13, 2026 US Market Close: S&P 500 $741.75 +0.54%, Nasdaq +0.59%

⚠️ Daily market snapshot — informational only This article summarizes publicly available yfinance data. It is not investment advice and does not recommend buying or selling any security. All investment decisions and outcomes are your own responsibility. 🧭 Market Sentiment: Greed 😊 (56/100) ██████░░░░ Estimated from VIX 17.68 📊 Market Breadth · 🟢 sectors 9/11 advancing (82%) · 🟡 Mag7 4/7 advancing (57%) Summary: S&P 500 $741.75 +0.54%, Nasdaq +0.59%, VIX 17.68. Leaders: XLB, XLF, XLU / Laggards: XLC, XLV, XLY. ...

June 13, 2026 · InvestIQs Editorial