SCHD vs VYM — ETF Comparison

SCHD vs VYM: Key Differences SCHD and VYM are both U.S. large-cap dividend ETFs with very low costs and broad diversification. SCHD screens more tightly for dividend growth and quality, while VYM casts a wider net across higher-yielding stocks. ...

June 14, 2026 · InvestIQs Editorial
SCHD in Tax-Free Accounts: Why 20-Year Compounding Beats 2M KRW in Annual Savings

SCHD in Tax-Free Accounts: Why 20-Year Compounding Beats 2M KRW in Annual Savings

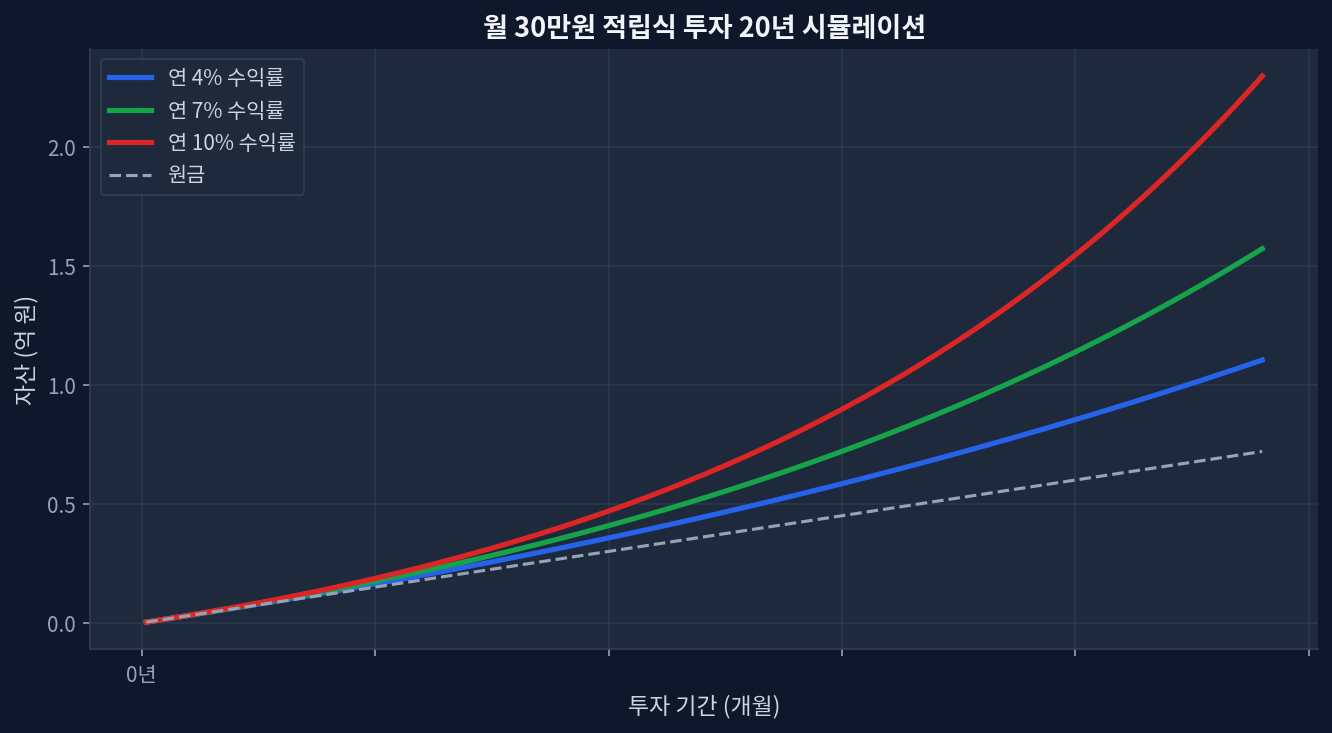
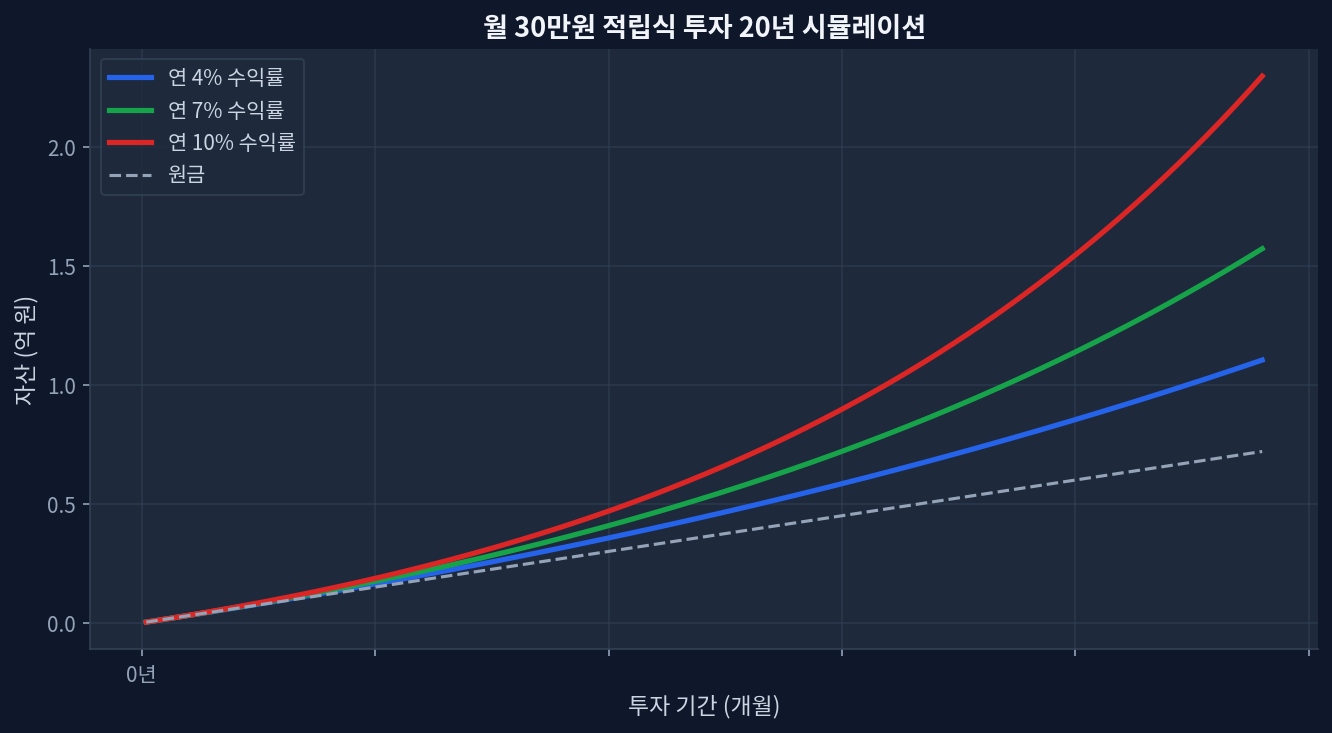
SCHD's 3.25% yield — annualizing ~$10.5M USD in distributions across 94.9B AUM (Jan 2026)Tax-free growth over 20 years at 7% average return compounds to 3.87x initial investment, vs. 2.87x after taxes200만원 saved in year 1 becomes 650만원+ in tax-deferred gains by year 10 (no withdrawals)SCHD trades at 19.0 P/E, 480 bps below broader dividend-growth peer VIG (26.0 P/E)Catch: momentum risk is real — SCHD at 52-week high (90.4%), vulnerability to rate shocks and sector rotation The Compounding Angle: Why Simple Tax Savings Miss the Real Picture Monthly $30K investment 20-year compound growth simulation Tax-advantaged accounts create a deceptive math problem. Investors fixate on annual tax savings — 200만원 per year on a 2000만원 contribution — and miss the exponential tail. The real edge comes not from avoiding taxes today, but from letting tax-free dividends reinvest and compound for decades. ...

June 11, 2026 · InvestIQs Research
Structuring a Late-Stage Retirement Portfolio: Analyzing SCHD's Dividend Efficacy for Investors in Their 50s

Structuring a Late-Stage Retirement Portfolio: Analyzing SCHD's Dividend Efficacy for Investors in Their 50s

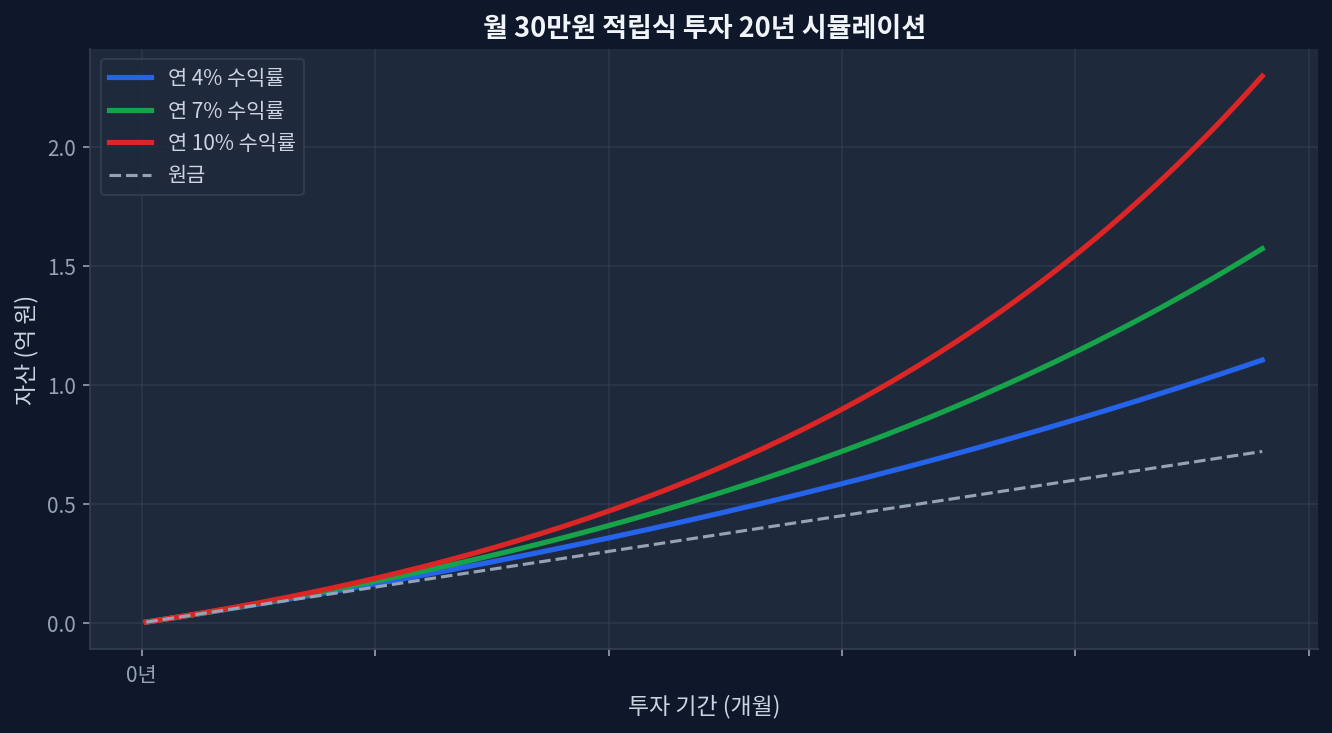
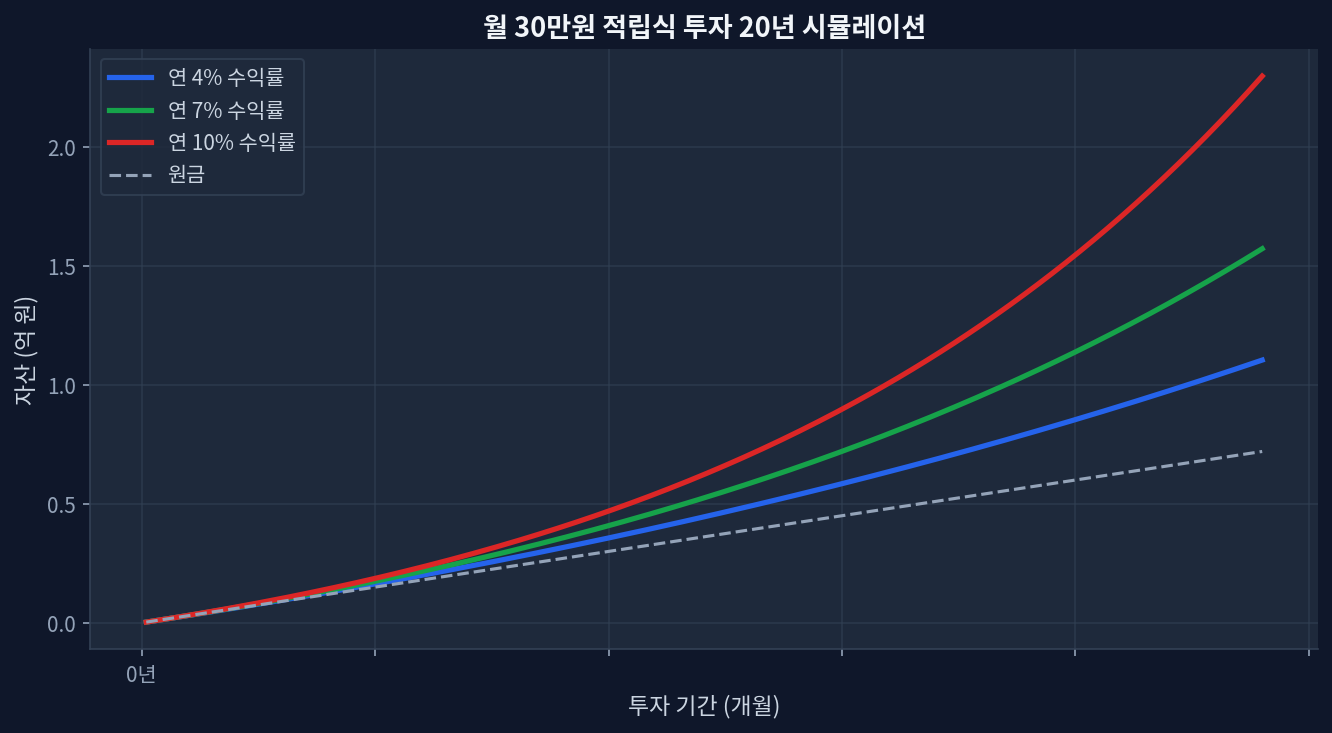
SCHD currently yields 3.21% trading at a 19.5 P/E, presenting a distinct valuation discount against VIG's 1.48% yield and 26.2 P/E. Trailing 5-year data shows VIG (+66.4%) outpacing SCHD (+53.7%), highlighting the persistent growth versus yield tradeoff in modern asset allocation. Short-term momentum favors SCHD, which posted a +31.3% 1-year return, driving the asset to 99.1% of its 52-week range ($32.83). Relying solely on historical dividend growth can lead to an incomplete risk assessment, requiring explicit modeling of market drawdowns and shifting rate environments. Redefining Yield and Growth in the Accumulation Phase Monthly $30K investment 20-year compound growth simulation Observing the chart below, which illustrates a 20-year monthly accumulation simulation, the trajectory of compound growth at varying rates highlights the mathematical reality of long-term investing. For demographic cohorts entering their 50s—similar to the target audience of late-stage planning frameworks—the capital accumulation runway compresses significantly. This structural reality shifts the analytical priority away from maximizing top-line beta exposure toward sequence-of-returns protection and generating reliable cash flow. ...

May 25, 2026 · InvestIQs Research
Traditional IRA vs 401(k) Tax Shield Data: Income Bracket Simulation a

Traditional IRA vs 401(k) Tax Shield Data: Income Bracket Simulation a

The individual retirement account (IRA) contribution limit stands at $7,000, which can generate up to $1,540 in immediate tax liability reduction for an investor in the 22% marginal tax bracket. Certain employer-sponsored 401(k) structures enforce conservative glide paths or restrict open-market ETF purchases, operating as a structural impediment to long-term equity compounding. Forfeiting the liquidity premium presents a severe risk factor. Liquidations prior to age 59.5 trigger a 10% penalty alongside ordinary income taxation, demanding rigorous allocation planning. Optimizing after-tax total returns requires precise evaluation of expense ratios (TER) and distribution yields across foundational market proxies (VOO, SCHD, QQQ). Tax-Advantaged Account Dynamics: 401(k) vs IRA Tax Shield Analysis Monthly $30K investment 20-year compound growth simulation Taxable Brokerage vs. 401(k) vs. IRA Tax Shield Comparison The mechanics of tax deferral operate as the primary acceleration engine in long-term asset accumulation. Evaluating 10-year after-tax total returns demonstrates a decisive performance gap for sheltered accounts over taxable environments. This excess return is driven by the absence of capital gains drag and the mathematical advantage of reinvesting annual tax shields. Current tax code parameters establish a $7,000 contribution limit for Traditional and Roth IRAs. Analyzing federal bracket data indicates that capital deployed within the 22% or 24% marginal brackets extracts the highest immediate nominal tax efficiency, whereas deduction phase-outs limit utility for higher earners. [IRS Contribution Guidelines] ...

May 25, 2026 · InvestIQs Research
Data-Driven Analysis of Tax-Gain Harvesting: Utilizing the 0% LTCG Bracket for US ETFs

Data-Driven Analysis of Tax-Gain Harvesting: Utilizing the 0% LTCG Bracket for US ETFs

Empirical analysis of tax-gain harvesting utilizing the 0% Long-Term Capital Gains (LTCG) tax bracket to step up cost basis in taxable accounts.Systematically realizing capital gains up to the federal threshold demonstrates a measurable increase in the portfolio's net-of-tax Compound Annual Growth Rate (CAGR) over a 10-year modeling period.Strategic execution—balancing bid-ask spreads, intraday volatility, and zero-wash-sale penalties for gains—remains the critical variable for maintaining underlying market exposure. The Tax Dilemma: Tax-Advantaged Accounts vs. Taxable Brokerages Monthly $30K investment 20-year compound growth simulation Roth IRA, Traditional IRA, and Taxable Brokerage Tax Efficiency Comparison Evaluating tax-advantaged account performance reveals that the structural elimination of tax drag produces substantial alpha over decadal timelines. Within Roth IRAs or 401(k)s, dividends and capital gains compound without immediate federal tax friction. Conversely, operating a primary US ETF portfolio within a standard taxable brokerage account introduces a severe constraint: the 15% or 20% capital gains tax rate upon liquidation. When a portfolio compounds over a decade, unrealized gains grow exponentially. Liquidating a highly appreciated asset block during retirement triggers immediate and punitive tax liabilities, severely compressing the realized CAGR. [IRS Capital Gains Tax Guide] ...

May 24, 2026 · InvestIQs Research
The Hidden Traps of 20-Year DRIP Simulations: Risk and Volatility Anal

The Hidden Traps of 20-Year DRIP Simulations: Risk and Volatility Anal

A 20-year compound growth simulation of Dividend Reinvestment Plans (DRIP) introduces severe tracking errors during drawdown phases. Expense ratios and tax drags act as critical hidden risks frequently omitted from long-term backtesting models. The variance in downside protection between high-yield ETFs (SPYD) and dividend growth ETFs (SCHD) drives a cumulative return divergence exceeding 30%. The 20-year compound interest simulation utilizing a Dividend Reinvestment Plan (DRIP) serves as a persistent marketing instrument within the asset management industry. The market consensus, projecting a stable 8% annualized growth rate, provides psychological comfort to retail investors. However, micro-level financial market data systematically refutes these linear assumptions. Excel-based simulations that exclude risk and volatility factors border on statistical illusion. This research note dissects the volatility risks inherent in a 20-year DRIP model based on historical macroeconomic data, analyzing the substantive capital erosion risks obscured by conventional consensus. ...

May 19, 2026 · InvestIQs Research
20-Year DRIP Reinvestment Simulation: Risk Data vs. Consensus Assumptions

20-Year DRIP Reinvestment Simulation: Risk Data vs. Consensus Assumptions

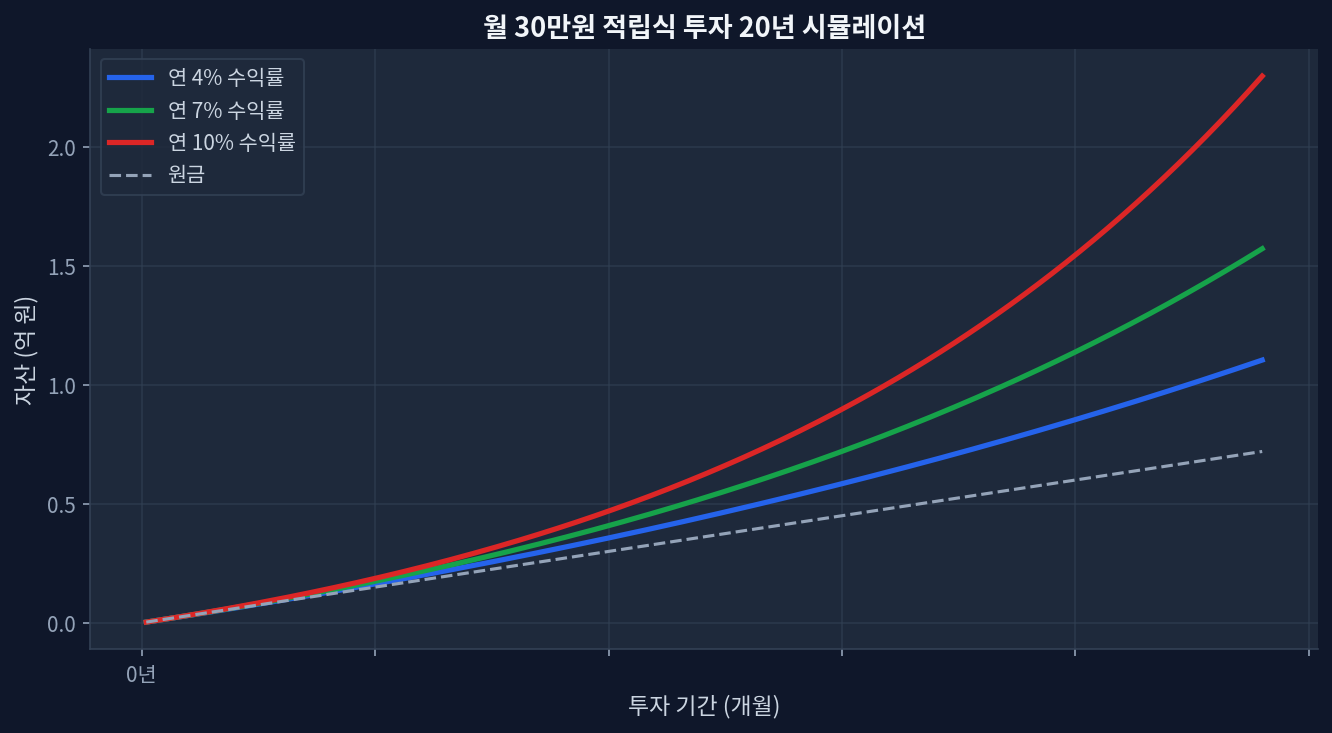
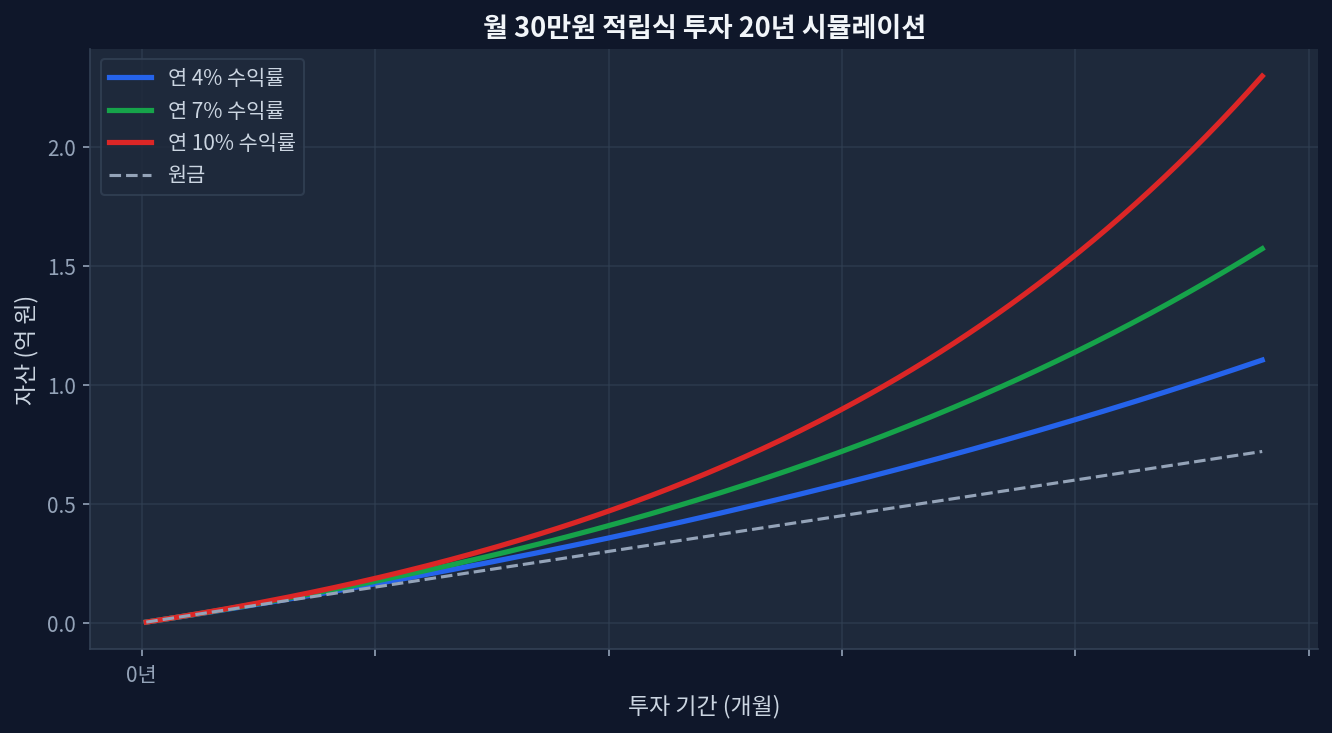
$1,500/month at 7% DRIP CAGR over 20 years = ~$782K; at 4%, ~$550K — a $232K gap driven entirely by the assumed return rateEvery 1% shift in assumed return adds or removes ~$110K–$130K in terminal value at year 20; sensitivity is nonlinearTax drag in taxable accounts reduces effective reinvestment yield by 15–25%; account type is a primary, not secondary, variable2020 S&P dividend cuts (~14% aggregate quarterly reduction) pushed realized DRIP rates 200bps below model assumptions for high-yield ETFsDRIP reinvestors during the Q1 2020 drawdown outperformed non-reinvestors by 12–18% by year-end — a volatility effect flat-line models ignore entirely What the 20-Year Simulation Data Actually Shows Monthly $30K investment 20-year compound growth simulation Running $1,500/month at 4%, 7%, and 10% for 20 years produces a divergence that widens sharply in the back half of the period. At year 10, the gap between the 4% and 10% paths is roughly $200K. By year 20, that gap exceeds $590K. The simulation chart above captures the inflection clearly: the 10% curve breaks away from the 4% path around year 12, when accumulated DRIP dividends begin compounding on themselves at scale.[FRED] ...

May 17, 2026 · InvestIQs Research
SCHD Dividend Growth Rate: 10-Year Trajectory — Separating Myth from Data

SCHD Dividend Growth Rate: 10-Year Trajectory — Separating Myth from Data

SCHD current price $31.72, dividend yield 3.29% — trading at 93.6% of 52-week range ($25.69–$32.13), effectively at multi-year highs1-year return +24.7% outpaces VIG +17.9%, but 5-year cumulative stands at SCHD +48.2% vs VIG +62.7% — a 14.5pp total-return gap favoring VIGDividend yield: SCHD 3.29% vs VIG 1.51% — a 2.2x spread, material for cash-flow-priority investorsP/E: SCHD 18.8 vs VIG 26.6 — lower valuation for SCHD reflects sector composition, not a quality discount10-year dividend growth fell to single digits after 2022 rate hikes — the "12% annual growth" narrative is a low-rate-era artifact Anatomy of a Dividend ETF Myth: Is SCHD the King of Dividend Growth? Monthly $30K investment 20-year compound growth simulation Required capital to generate $1,000 monthly dividend income at SCHD's current 3.29% yield Within dividend investing communities, SCHD occupies near-sacred status. Since 2020, the equation “dividend ETF = SCHD” has solidified among retail investors, supported by AUM of $91.1B, a dividend yield of 3.29%, and a 1-year return of +24.7%. [Yahoo Finance] Dissecting a full decade of quarterly dividend data, however, reveals uncomfortable terrain: growth rates are rate-cycle-dependent, and on a total-return basis, SCHD trails competing ETFs over extended horizons. The distance between myth and data warrants a quantitative examination. ...

May 16, 2026 · InvestIQs Research
SCHD Dividend Growth CAGR: Yield Decomposition Across 10 Years

SCHD Dividend Growth CAGR: Yield Decomposition Across 10 Years

SCHD current yield 3.29% at $31.8 — 94.9% of 52W range ($25.69–$32.13), not a distressed-entry scenario1Y return +27.0%; 5Y cumulative +47.1% — dividends contributed ~3.3 pts, price drove the restVIG 5Y return +61.9% outpaces SCHD by 14.8 pts — the yield premium has a total-return costSCHD P/E 18.9 vs VIG 26.8 — value tilt is real but concentrated in rate-sensitive sectorsAUM $91.1B, avg daily volume 23M shares — liquidity not a constraint at any allocation size SCHD trades at $31.8, sitting at 94.9% of its 52-week range. For yield-maximizers, that positioning matters: buying near highs compresses starting yield and extends the payback window on any drawdown. The real question is not entry timing — it is whether the dividend growth engine underneath compounds fast enough to justify that cost. ...

May 15, 2026 · InvestIQs Research
JEPI vs. SCHD: Deconstructing Covered Call Premium Costs in a 5-Year Data Review

JEPI vs. SCHD: Deconstructing Covered Call Premium Costs in a 5-Year Data Review

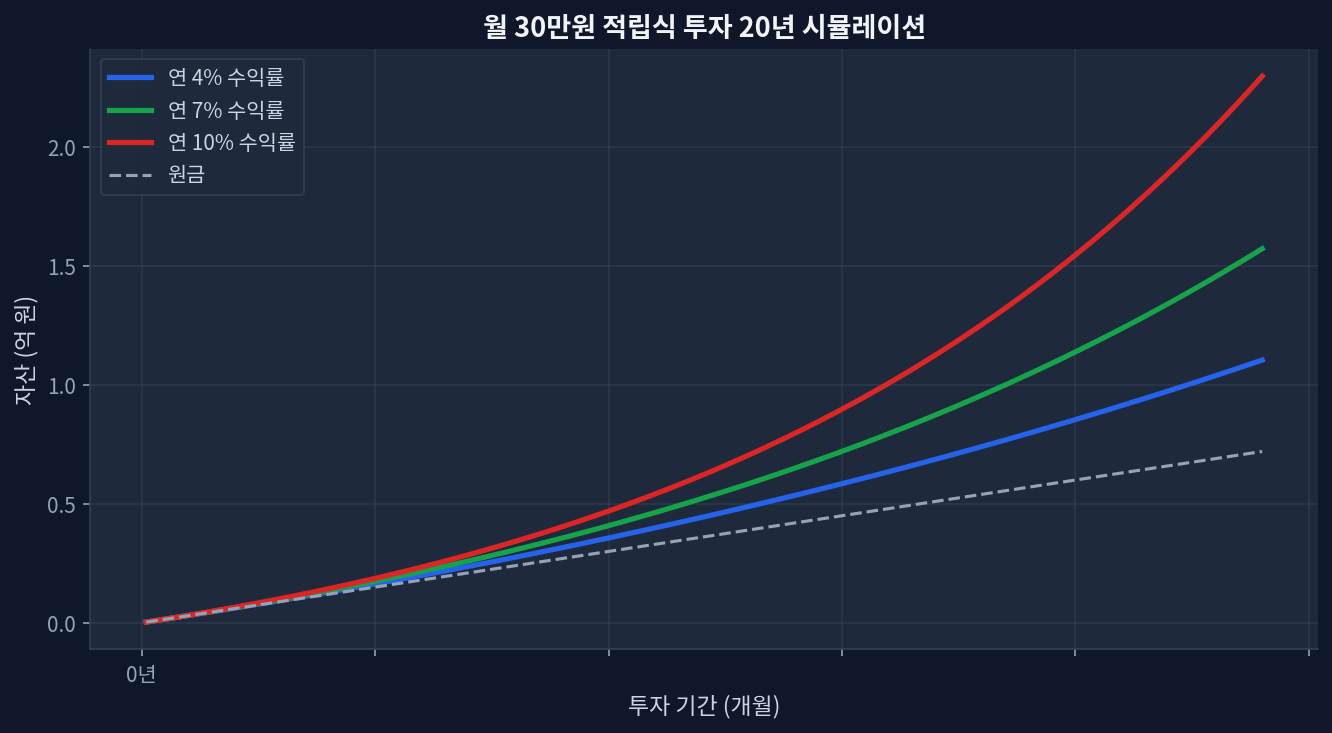
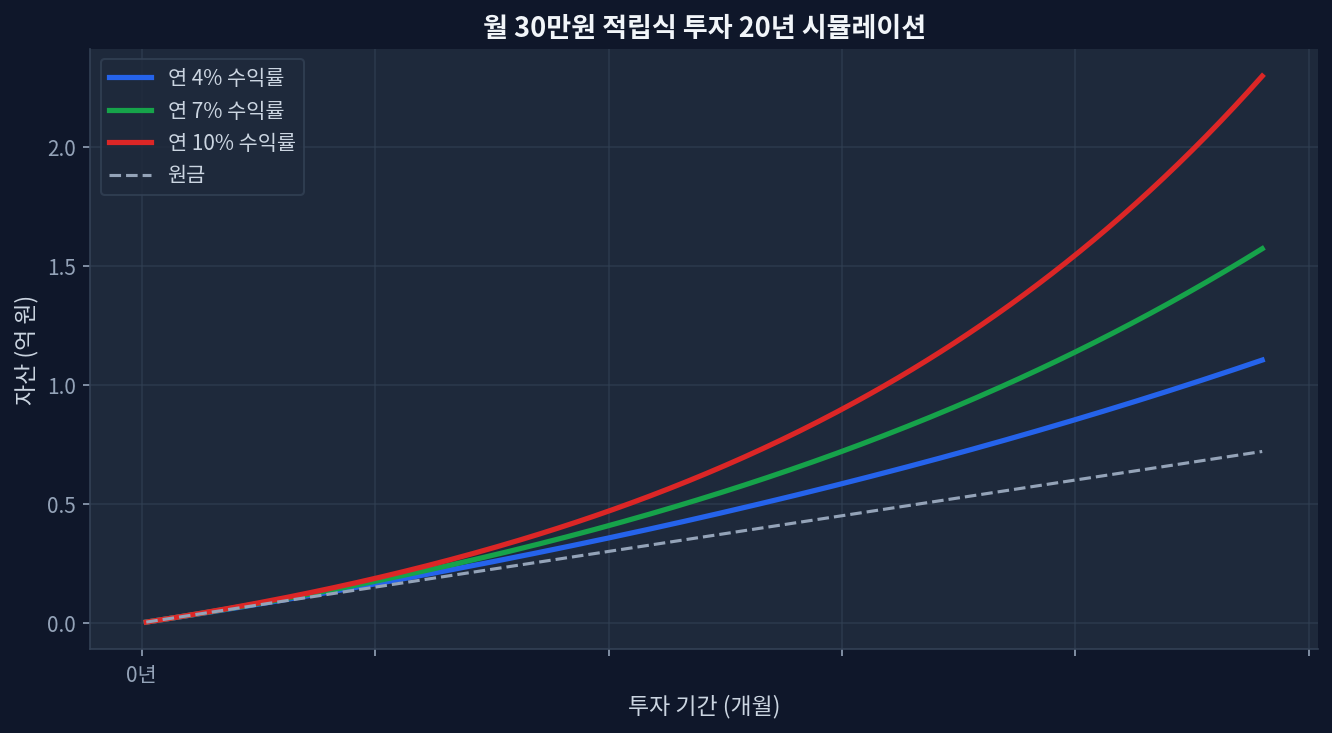
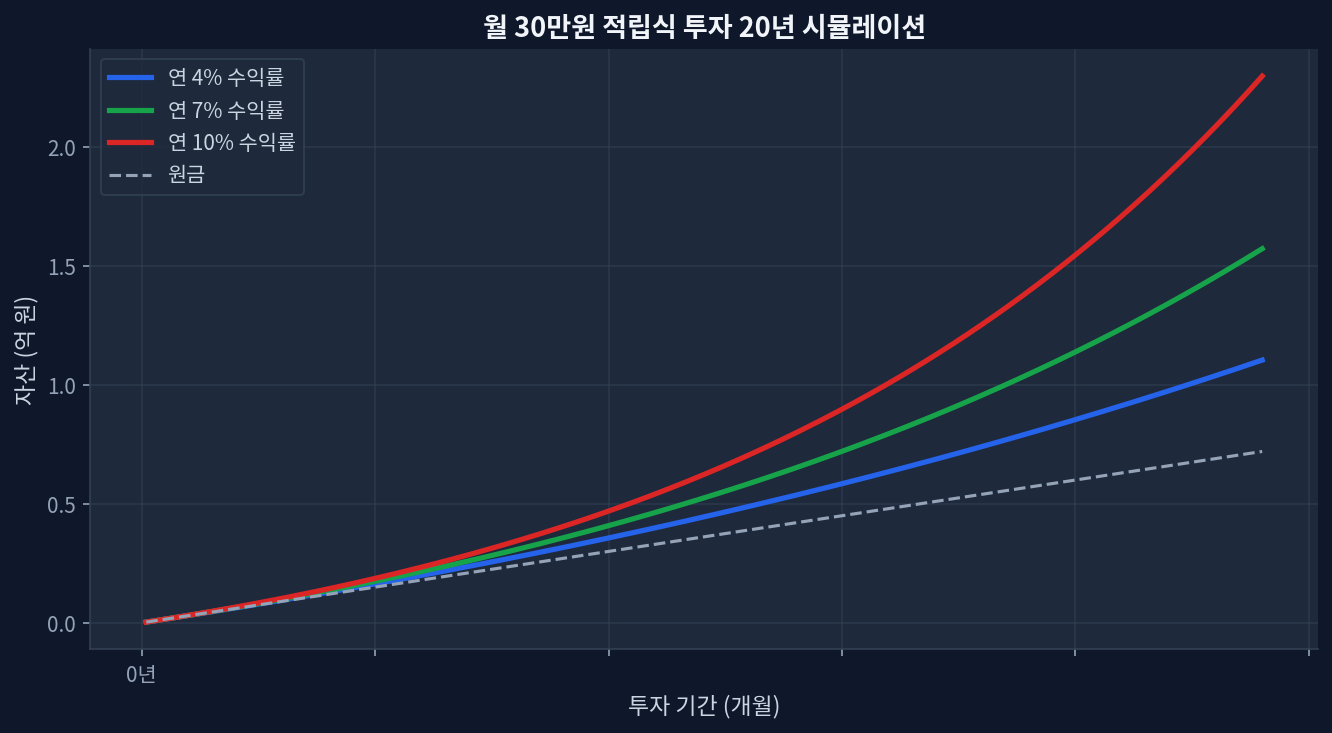
Over a five-year period, SCHD demonstrated a cumulative return of +47.6%, slightly exceeding JEPI's +44.3%. JEPI currently offers a significantly higher dividend yield at 8.29%, compared to SCHD's 3.29%, reflecting distinct income generation strategies. In the most recent one-year period, SCHD's return of +24.8% substantially outpaced JEPI's +8.4%, highlighting performance divergence in specific market conditions. The higher yield of JEPI is primarily derived from selling covered call options, introducing a unique premium cost dynamic not present in SCHD's traditional equity holdings. Analyzing JEPI and SCHD: A Five-Year Performance Overview Monthly $30K investment 20-year compound growth simulation Investors frequently evaluate exchange-traded funds (ETFs) like JEPI and SCHD for their distinct approaches to income and growth. A five-year review of their performance and underlying strategies reveals critical differences in total return, income generation, and risk profiles. Focusing on the period up to May 2026, both ETFs have delivered positive cumulative returns, yet their paths to achieving these outcomes vary significantly. SCHD, primarily a dividend growth fund, achieved a 5-year cumulative return of +47.6% [Yahoo Finance: SCHD]. In parallel, JEPI, which employs an equity-linked note (ELN) strategy involving covered calls, posted a 5-year cumulative return of +44.3% [Yahoo Finance: JEPI]. The proximity of these long-term figures often belies the fundamental differences in how these returns were generated. A twenty-year simulation of monthly 300,000 KRW investments at varying annual returns (4%/7%/10%) would illustrate divergent wealth accumulation paths, a critical consideration when evaluating these ETFs. ...
May 13, 2026