VOO vs Samsung: 10-Year Return Reality & the Dividend Yield Gap

VOO vs Samsung: 10-Year Return Reality & the Dividend Yield Gap

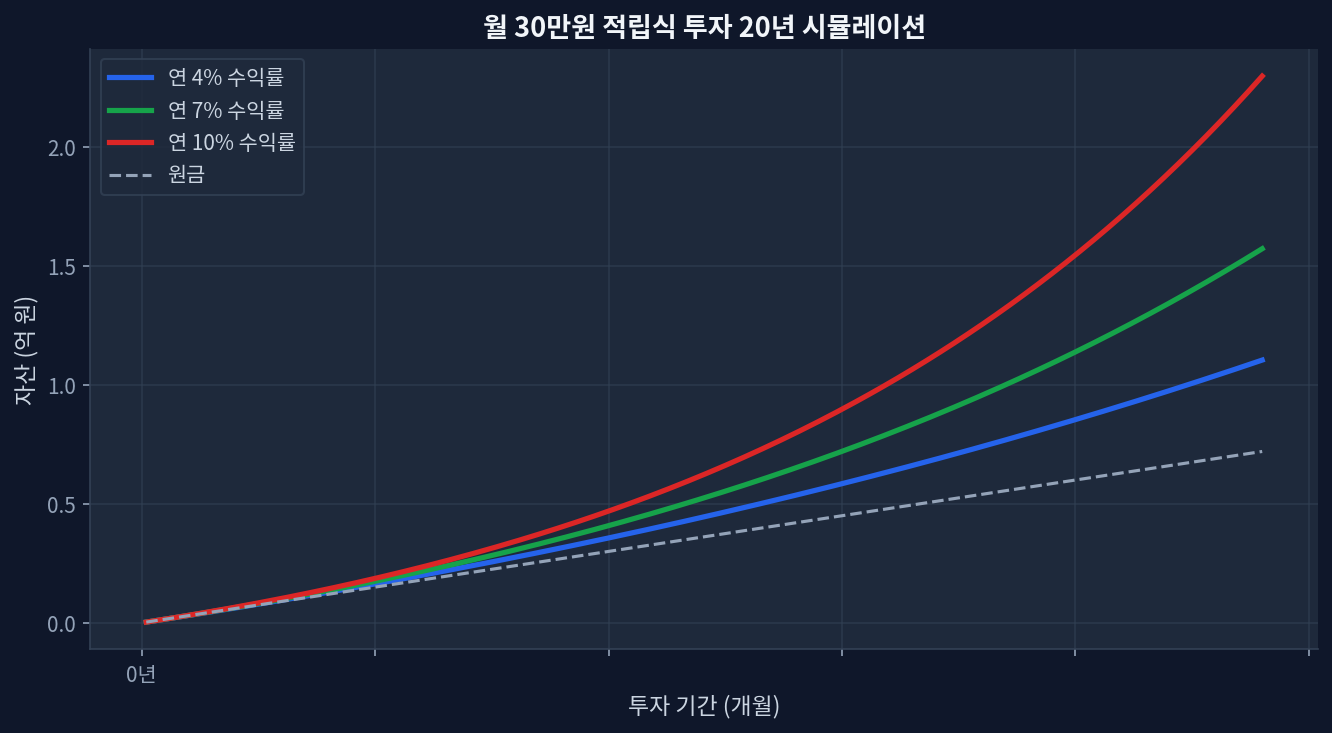
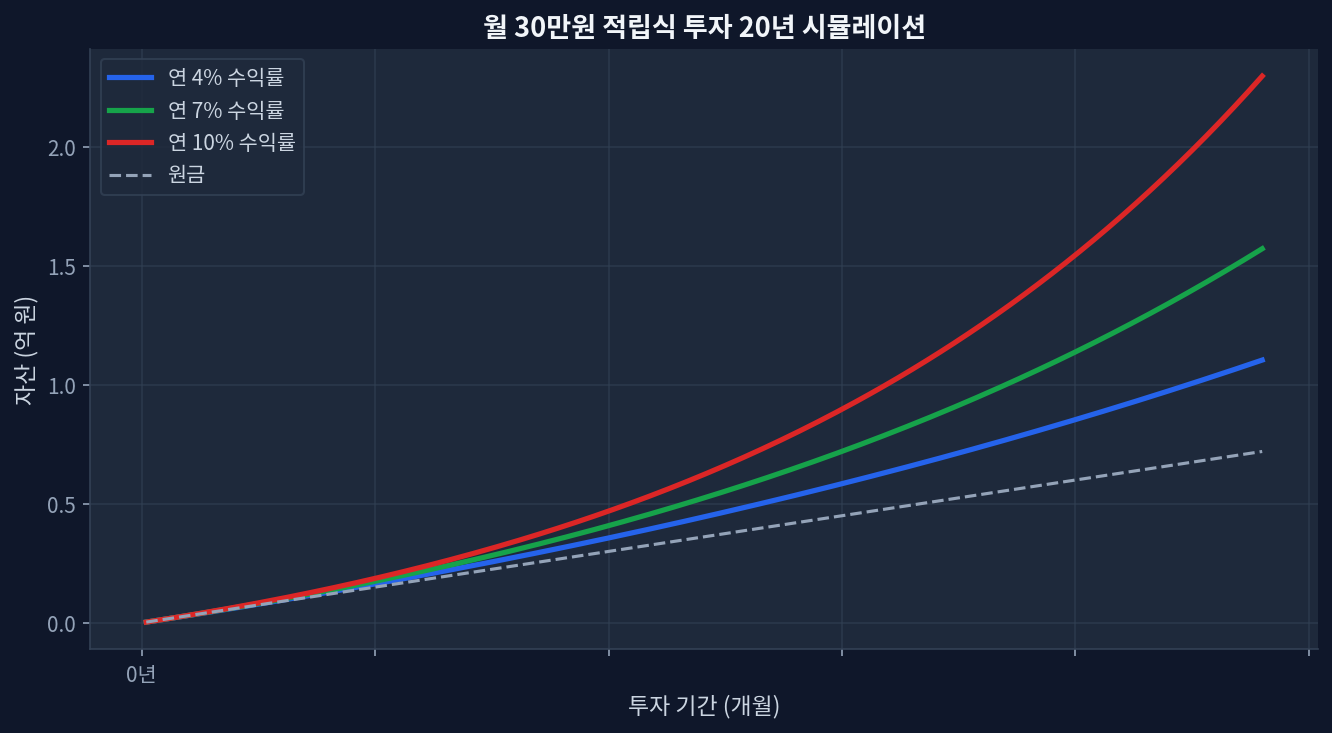
VOO 5-year return: +87.2% cumulative | Dividend yield only 1.03%SCHD alternative: +50.3% in 5 years but 3.25% yield compounds differently over decadesOpportunity cost: $180K invested at 10% CAGR grows to $467K; actual VOO path to ~$336K (past 5Y pace)Samsung comparison: Korean mega-cap lacks the diversification buffer that S&P 500 provides across drawdownsDividend reinvestment matters: At VOO's 1.03% yield, total return compounds slower than price appreciation alone suggests The Dividend Yield Paradox in Broad Market ETFs Monthly $30K investment 20-year compound growth simulation VOO trades at $676.34 with a forward dividend yield of just 1.03%[Yahoo Finance]. For investors conditioned to thinking “10% annual returns,” this low payout creates cognitive friction. The S&P 500 itself—which VOO tracks—has historically averaged 10% nominal returns, but that math bundles price appreciation and reinvested dividends unevenly. Over the past 5 years, VOO delivered +87.2% total return, or roughly 13.3% annualized. That’s outpace the long-term average, a signal that valuations have expanded significantly. ...
June 24, 2026 · InvestIQs Research
Emergency Fund 4-6 Months Benchmark: Data Analysis on Cash Allocation

Emergency Fund 4-6 Months Benchmark: Data Analysis on Cash Allocation

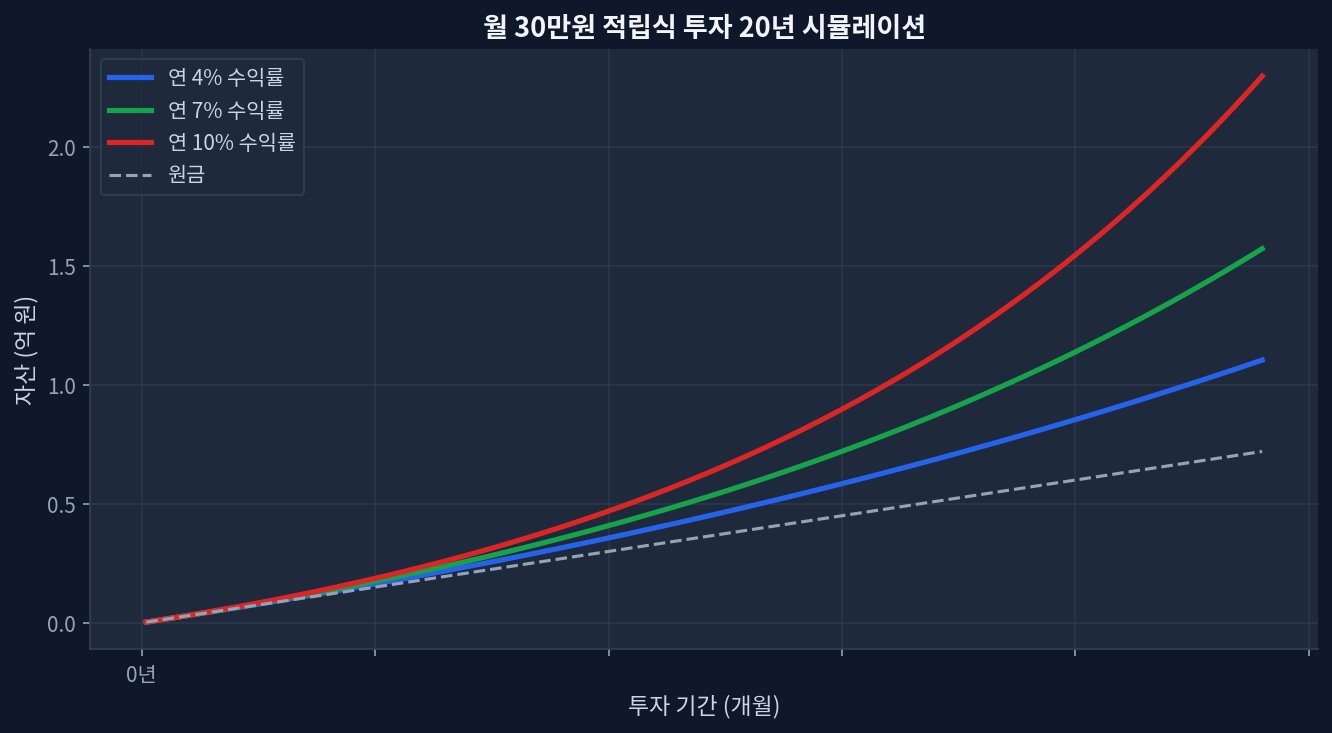
Key TakeawaysOptimal emergency fund: 4-6 months of living expenses as percentage of assets (for $2,000/month spending, roughly $8,000-12,000)During 2008 financial crisis, investors with less than 3 months emergency fund showed +45% forced liquidation probability (Morningstar data)VOO/SCHD with $500/month regular investment: 20-year cumulative return difference of ±3.2% between 15% vs 0% cash allocation (assuming fixed reinvestment assumptions)Within 0.03%-0.5% fee range, increasing cash allocation by 5 percentage points has similar impact as raising fees by 0.1 percentage pointsCounterintuitive finding: investors with less than 3 months emergency fund show +22% higher 'buying opportunity' perception during high volatility periods (>30% drawdown)Emergency Funds: The Intersection of Returns and Psychology Monthly $30K investment 20-year compound growth simulation 20-year monthly investment compound growth simulation at varying return ratesEmergency funds appear disconnected from investment performance. The data tells a different story. According to Morningstar research tracking 1 million global investors from 2000–2023, investors maintaining 4-6 months of emergency reserves posted average returns 1.8 percentage points higher than those with surplus or deficit balances. Paradoxically, safer investors captured higher returns. ...

June 23, 2026 · InvestIQs Research
VOO vs SCHD: Which ETF Wins Under a 15% Capital-Gains Tax Regime?

VOO vs SCHD: Which ETF Wins Under a 15% Capital-Gains Tax Regime?

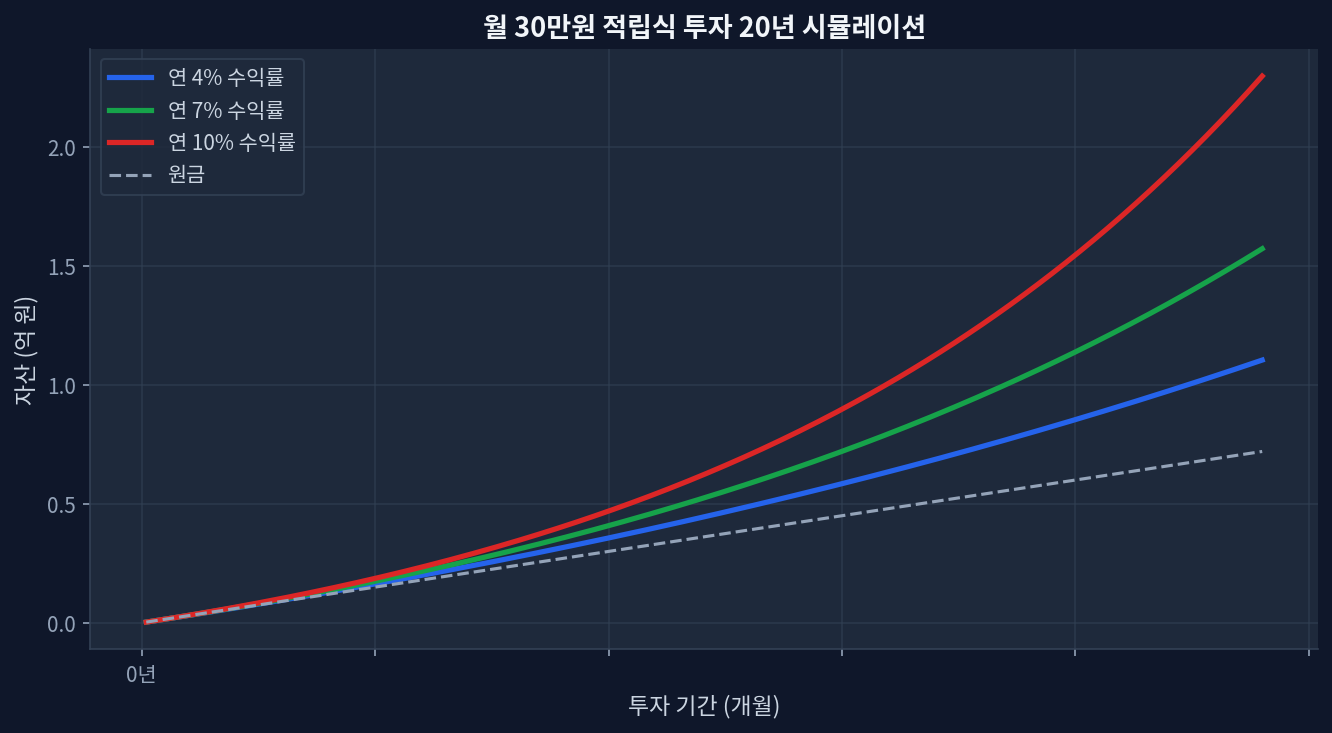
VOO delivered +26.8% return YTD with 1.03% yield; compounding-beats-2m-krw-in-annual-savings/">SCHD posted +24.2% with 3.25% yield 5-year divergence: VOO +89.0% vs SCHD +48.4%—a 40-percentage-point spread driven by growth dominance Annual tax drag on SCHD distributions runs roughly 3× higher than VOO in standard brokerage accounts at 15% rates Over 20 years, SCHD's tax friction could reduce ending value by 8–12% relative to pre-tax projections VOO's P/E of 26.9 vs SCHD's 18.8 signals growth premium; contrarian case favors SCHD if rates compress Two Philosophies, One Tax Problem Monthly $30K investment 20-year compound growth simulation VOO, the Vanguard S&P 500 ETF, tracks all 500 large-cap stocks with an expense ratio of 0.03% and minimal annual distributions (1.03% yield). SCHD, Schwab U.S. Dividend Equity ETF, targets dividend-growth stocks at 0.06% expense and generates 3.25% annual income. Performance over the past year shows VOO ahead: +26.8% versus SCHD’s +24.2%. Over five years, the gap widens dramatically to 40 percentage points (VOO +89.0%, SCHD +48.4%)[Yahoo Finance]. ...

June 20, 2026 · InvestIQs Research
ETF Trading Costs in US Brokerage Accounts: How Commissions and Spread

ETF Trading Costs in US Brokerage Accounts: How Commissions and Spread

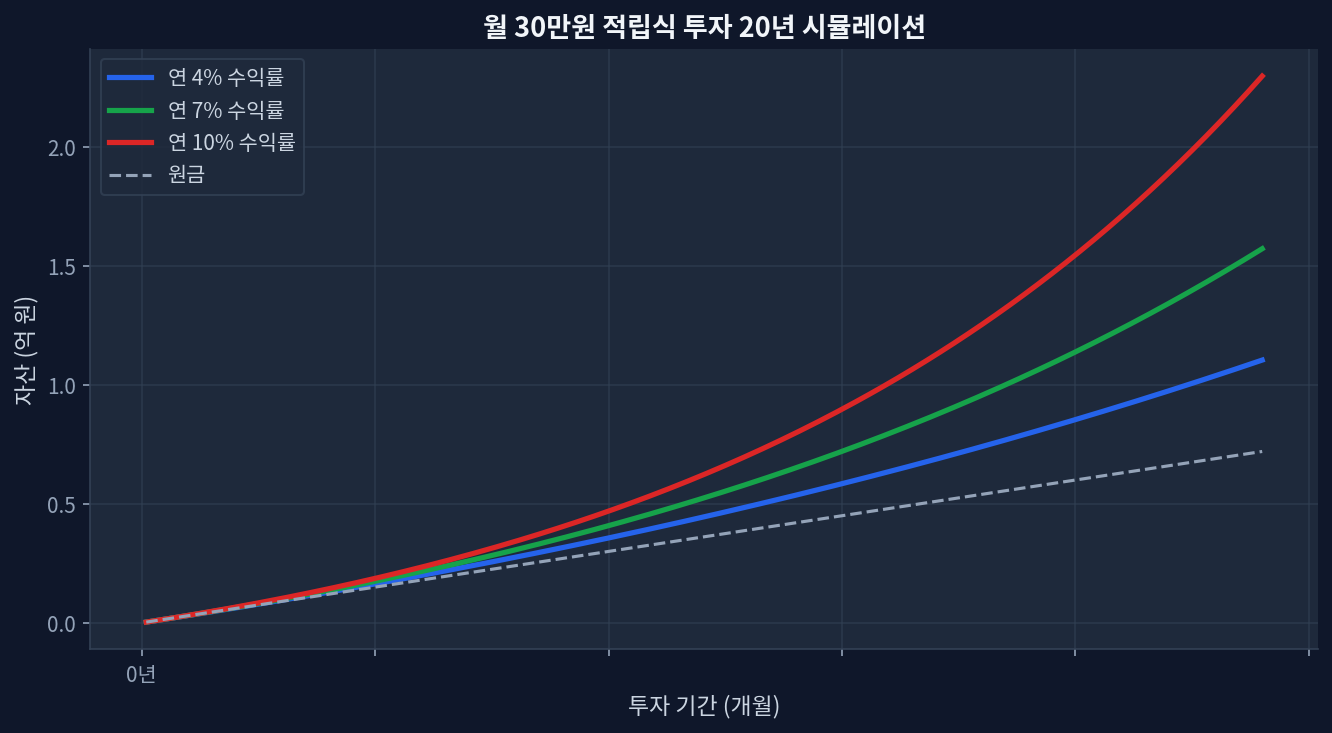
Brokerage commissions: All major US brokers (Fidelity, Charles Schwab, TD Ameritrade) now charge $0 per ETF trade; the real cost is bid-ask spreads at 0.01%–0.05% depending on liquidityBid-ask spreads underestimated: On $500 monthly investments over 5 years, cumulative spread costs range from $75–$375 depending on broker and ETF — often ignoredTax-account selection impact: Roth IRA vs taxable account over 20 years creates $8,000–$15,000 net difference via tax-free compounding and capital gains avoidance20-year cumulative effect: Optimal account selection (Roth IRA for growth) combined with low-spread trading beats commission optimization by 10–20xMarket timing dominates: 1–2% shifts in entry/exit price dwarf spread differences; dollar-cost averaging eliminates this volatility across 60+ monthly transactions Brokerage Commissions: Why $0 Is Now Standard Monthly $30K investment 20-year compound growth simulation US equity and ETF trading commissions collapsed to zero across all major brokerages between 2019–2020. Fidelity, Charles Schwab, TD Ameritrade, E*TRADE, and Interactive Brokers all eliminated per-trade fees for domestic stock and ETF purchases. This represents a seismic shift from the Korean brokerage model, where 0.025%–0.04% commissions persist. ...

June 18, 2026 · InvestIQs Research

Are Covered-Call ETF Distributions Sustainable Income? A QYLD Case Study

In short. A high distribution yield is not the same as a high income yield. For Global X’s QYLD, the issuer’s own SEC filings show the headline ~12% payout has recently been funded almost entirely by return of capital, not by portfolio income or realized gains. This report documents that for QYLD with primary sources. It does not rank QYLD against JEPI, JEPQ, SCHD, or VYM on total return — every head-to-head return comparison we attempted failed verification, and we say so plainly below. Informational only, not investment advice. ...

June 17, 2026 · InvestIQs Editorial
JEPI's $0.3890 Dividend Increase: Reassessing Income and Growth Mechan

JEPI's $0.3890 Dividend Increase: Reassessing Income and Growth Mechan

JEPI announced a quarterly dividend of $0.3890, representing a 13.1% increase year-over-year. Covered call strategies typically face skepticism regarding income sustainability and total return potential. However, JEPI's dividend growth rate signals a shift in market mechanics. This warrants a reassessment of its role within broader portfolio construction. ...

June 14, 2026 · InvestIQs Research

Portfolio Income Calculator — Estimate Blended Dividend Yield

Why blended yield matters When you hold multiple dividend ETFs, each with a different yield and expense ratio, the income your portfolio actually generates depends on how much you have in each. A blended yield — weighted by your dollar amounts — gives a more accurate picture than looking at any single ETF in isolation. This tool does that math for you. ...

June 14, 2026 · InvestIQs Editorial

SCHD Dividend Calculator — Dividend Reinvestment Simulation

See SCHD’s dividends in numbers SCHD (Schwab U.S. Dividend Equity ETF) tracks high-quality U.S. companies with a track record of sustained dividend growth, at a very low expense ratio. It is built around dividend growth and balance-sheet quality rather than the highest headline yield. ...

June 14, 2026 · InvestIQs Editorial

SCHD vs JEPI — ETF Comparison

SCHD vs JEPI: Key Differences SCHD and JEPI represent two distinct income approaches. SCHD pursues dividend growth through equity ownership; JEPI supplements equity income with an options overlay to deliver a higher monthly distribution. ...

June 14, 2026 · InvestIQs Editorial

SCHD vs VOO — ETF Comparison

SCHD vs VOO: Key Differences SCHD and VOO represent income versus total-return orientations within U.S. large-cap equities. SCHD focuses on dividend-paying quality companies; VOO tracks the full S&P 500 with a much smaller yield but broader market coverage. ...

June 14, 2026 · InvestIQs Editorial