JEPI Quarterly Dividend Raised 10.3%, Yet Growth Stagnation Signals Ca
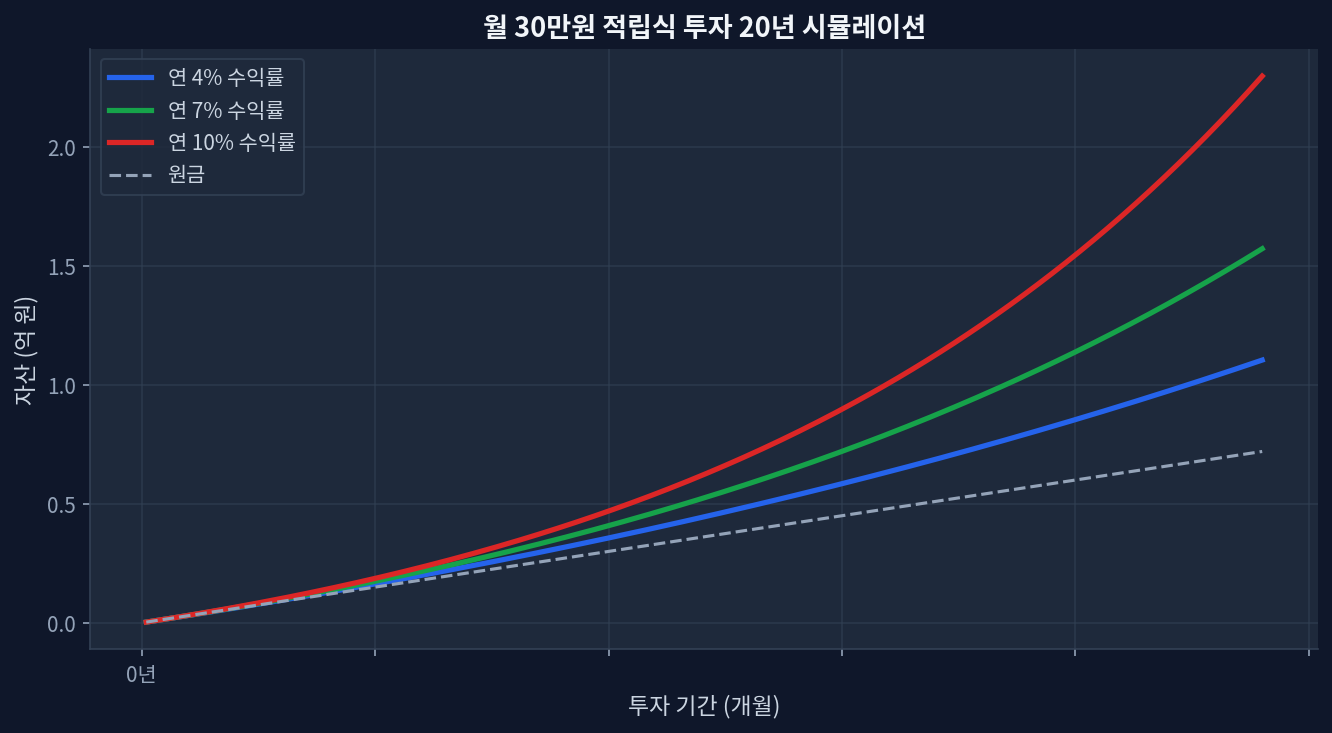
schd-deconstructing-covered-call-premium-costs-in-a-5-year-data-review/">JEPI quarterly dividend announcement: $0.3870 (+10.3% year-over-year increase)Current dividend yield: 8.08% (elevated) vs. 1-year total return: +7.4% (weak)5-year cumulative return: +42.5% vs. SCHD +54.9% (2.4% annualized gap)P/E ratio 26.8 (40% premium to SCHD's 19.0); trading at 30.2% of 52-week range (bearish signal)Cash outflow pressure: elevated dividend payments reduce retained capital, weakening share price defense The Structural Dilemma Hidden in Dividend Growth Monthly $30K investment 20-year compound growth simulation Monthly $2,000 Recurring Investment Over 20 Years: Compound Growth Simulation JEPI’s quarterly dividend increase to $0.3870 appears favorable on the surface. A 10.3% jump from the prior-year quarter’s $0.3508 demonstrates consistency. Yet for a $44.7 billion ETF to draw attention primarily on dividend growth itself represents a structural problem. ...