VYM Quarterly Dividend Increase to $0.98 — Reassessing Tax-Efficient D

VYM Quarterly Dividend Increase to $0.98 — Reassessing Tax-Efficient D

VYM announces quarterly dividend of $0.98 — a 13.7% increase year-over-yearNew dividend yield approximately 2.48% (yfinance currently reflects 2.21%, will update post-announcement)After qualified dividend taxes (15% federal rate for most investors), net yield drops to 2.10%5-year cumulative total return of +72.5% outpaces SCHD (+48.4%), with price appreciation driving most gainsTax-deferred accounts like traditional IRAs can shelter dividend income entirely, preserving the full 2.48% yield VYM Dividend Increase: Reading the Numbers Monthly $30K investment 20-year compound growth simulation 20-year compound growth simulation: monthly 500-dollar investment Vanguard High Dividend Yield ETF (VYM) announced a quarterly dividend of $0.98 per share for the current period, representing a 13.7% increase from the previous quarter. In absolute terms, that translates to a $0.1346 per-share increase. The prior quarterly dividend was approximately $0.8620, and with the new distribution, the annualized dividend yield climbs to $3.92 from the previous $3.45 estimate. ...
June 20, 2026 · InvestIQs Research
ETF Trading Costs in US Brokerage Accounts: How Commissions and Spread

ETF Trading Costs in US Brokerage Accounts: How Commissions and Spread

Brokerage commissions: All major US brokers (Fidelity, Charles Schwab, TD Ameritrade) now charge $0 per ETF trade; the real cost is bid-ask spreads at 0.01%–0.05% depending on liquidityBid-ask spreads underestimated: On $500 monthly investments over 5 years, cumulative spread costs range from $75–$375 depending on broker and ETF — often ignoredTax-account selection impact: Roth IRA vs taxable account over 20 years creates $8,000–$15,000 net difference via tax-free compounding and capital gains avoidance20-year cumulative effect: Optimal account selection (Roth IRA for growth) combined with low-spread trading beats commission optimization by 10–20xMarket timing dominates: 1–2% shifts in entry/exit price dwarf spread differences; dollar-cost averaging eliminates this volatility across 60+ monthly transactions Brokerage Commissions: Why $0 Is Now Standard Monthly $30K investment 20-year compound growth simulation US equity and ETF trading commissions collapsed to zero across all major brokerages between 2019–2020. Fidelity, Charles Schwab, TD Ameritrade, E*TRADE, and Interactive Brokers all eliminated per-trade fees for domestic stock and ETF purchases. This represents a seismic shift from the Korean brokerage model, where 0.025%–0.04% commissions persist. ...

June 18, 2026 · InvestIQs Research
Tax-Optimized SPY Growth: Building $500K Over 20 Years

Tax-Optimized SPY Growth: Building $500K Over 20 Years

Key Takeaways$500/month SPY investment reaches $495K–$560K after 20 years (7–10% annual returns, depending on tax scenario)Tax-advantaged accounts compound ~$100K–$150K more wealth than taxable accounts due to deferred or eliminated taxesDividend tax drag: SPY's 1.0% yield generates ~$7,400 in taxable income annually in year 20 (if held in taxable brokerage)Long-term capital gains rate: 15–20% federal (depending on income bracket), plus 0–13% state taxValuation risk: SPY's P/E of 26.5 is historically elevated; 5–8% returns more realistic than past decade's 25%+ returns Why Tax Strategy Trumps Fund Selection in Long-Term Wealth Building Monthly $30K investment 20-year compound growth simulation Most investors focus on beating the market or picking the right fund. They miss a bigger opportunity: minimizing taxes. Consider this: a portfolio growing at 9% annually in a taxable account effectively grows at 6.5–7% after taxes (assuming 25% blended tax rate on dividends and capital gains). The same portfolio in a Roth IRA grows at the full 9% tax-free. ...

June 18, 2026 · InvestIQs Research
Tax-Advantaged Account ETF Allocation: 5-Year Effective Tax Rate Analy

Tax-Advantaged Account ETF Allocation: 5-Year Effective Tax Rate Analy

Operating US-listed ETFs within a tax-advantaged account (Roth IRA) reduces the effective tax rate on long-term gains and qualified dividends from 15% (taxable) to 0%. Contrary to the high-yield narrative, focusing on total return (TR) and automated dividend reinvestment (DRIP) structurally maximizes the tax-deferral compounding effect. Strategic asset location over a 5-year horizon serves as the primary driver for compounding total returns. Tax-Advantaged Account Structures and 5-Year Efficacy Taxable Brokerage vs Traditional IRA vs Roth IRA Tax Effect Comparison From an asset allocation perspective, the structural advantages of tax-sheltered accounts are highly pronounced. A taxation system that levies annual taxes on dividend income and realized capital gains in standard brokerage accounts introduces significant drag on a portfolio’s compounding trajectory. Analyzing the ‘Taxable vs Roth IRA After-Tax Return (10,000 USD, 10 Years)’ data, the compounding curve of tax-deferred or tax-free assets exhibits superior resilience and a steeper growth rate compared to standard taxable accounts over long horizons. Specifically, the tax treatment of dividend distributions over a 5-year period acts as a critical variable controlling the portfolio’s effective tax drag. The compounding effect of reinvested capital is subtle in initial years but drives the aggregate asset growth exponentially over time. [ETF[.com]](https://www.etf.com) ...

May 21, 2026 · InvestIQs Research
Roth IRA vs Traditional IRA: 5-Scenario Capital Gains Tax Decomposition

Roth IRA vs Traditional IRA: 5-Scenario Capital Gains Tax Decomposition

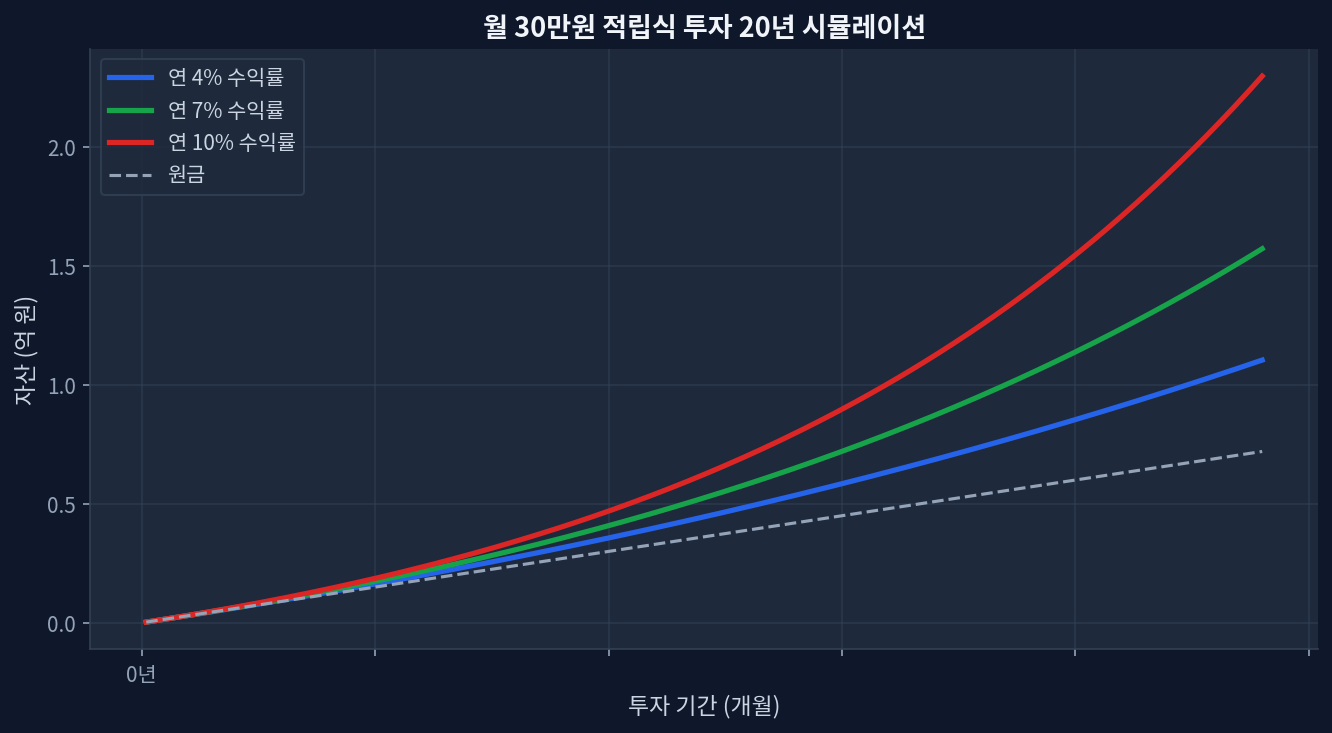
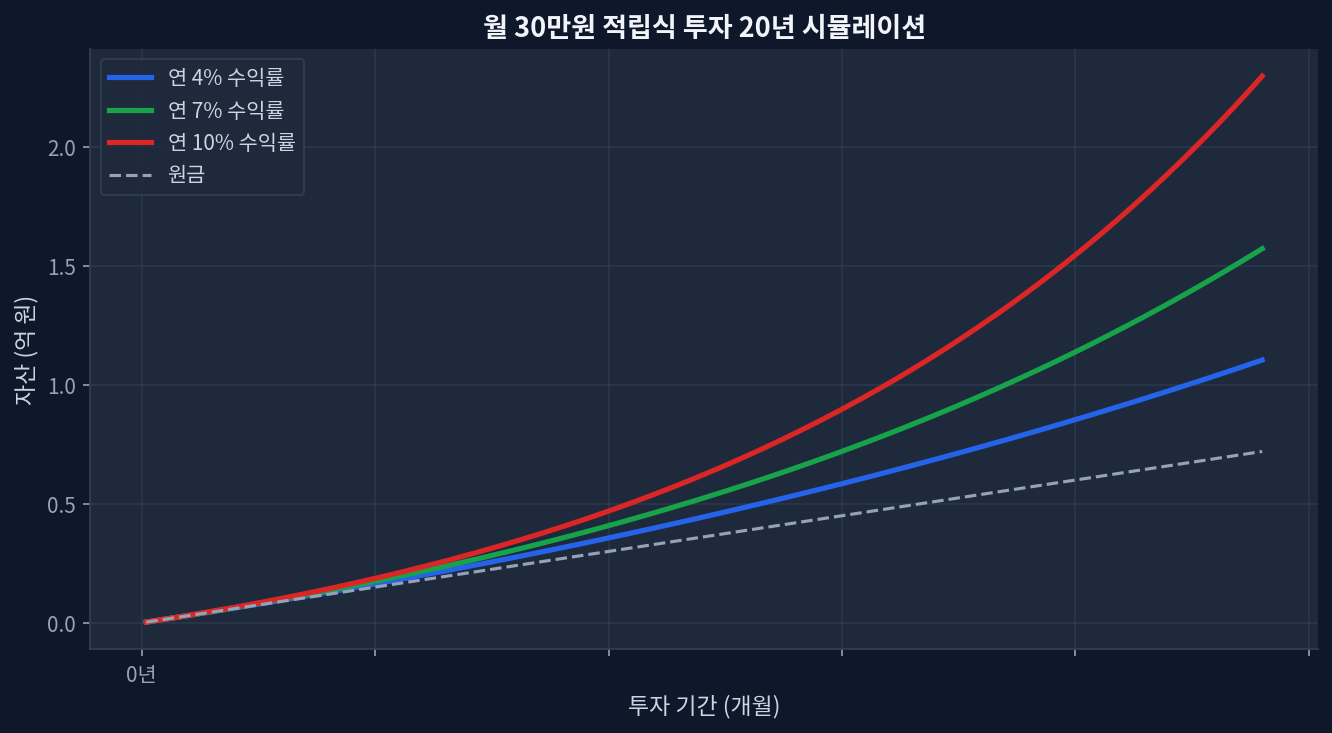
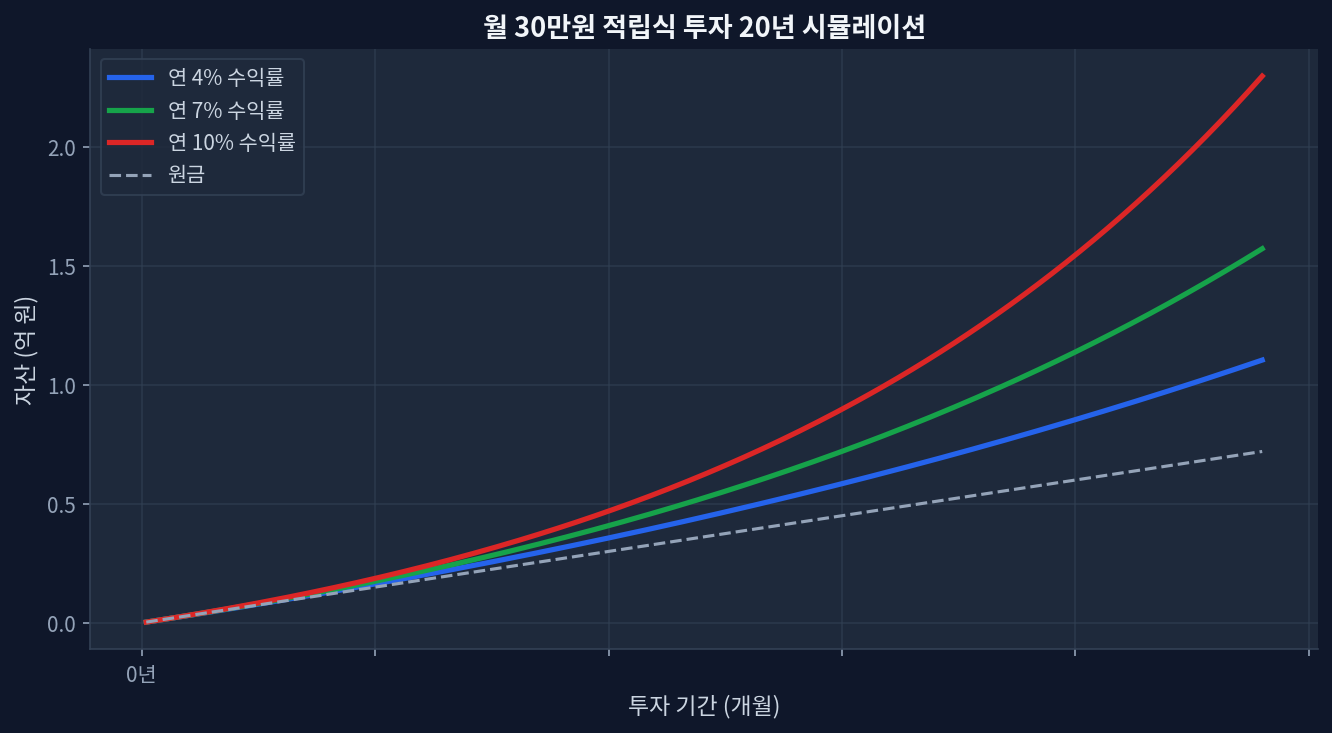
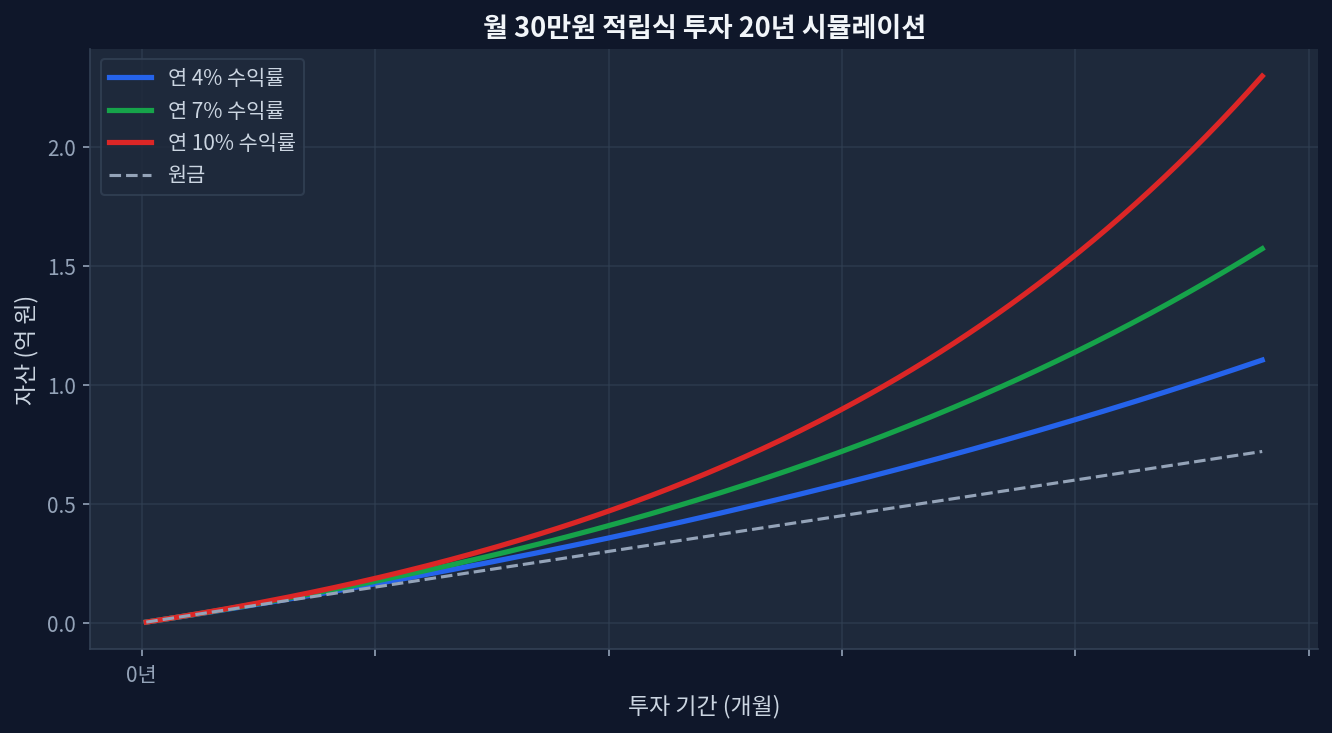
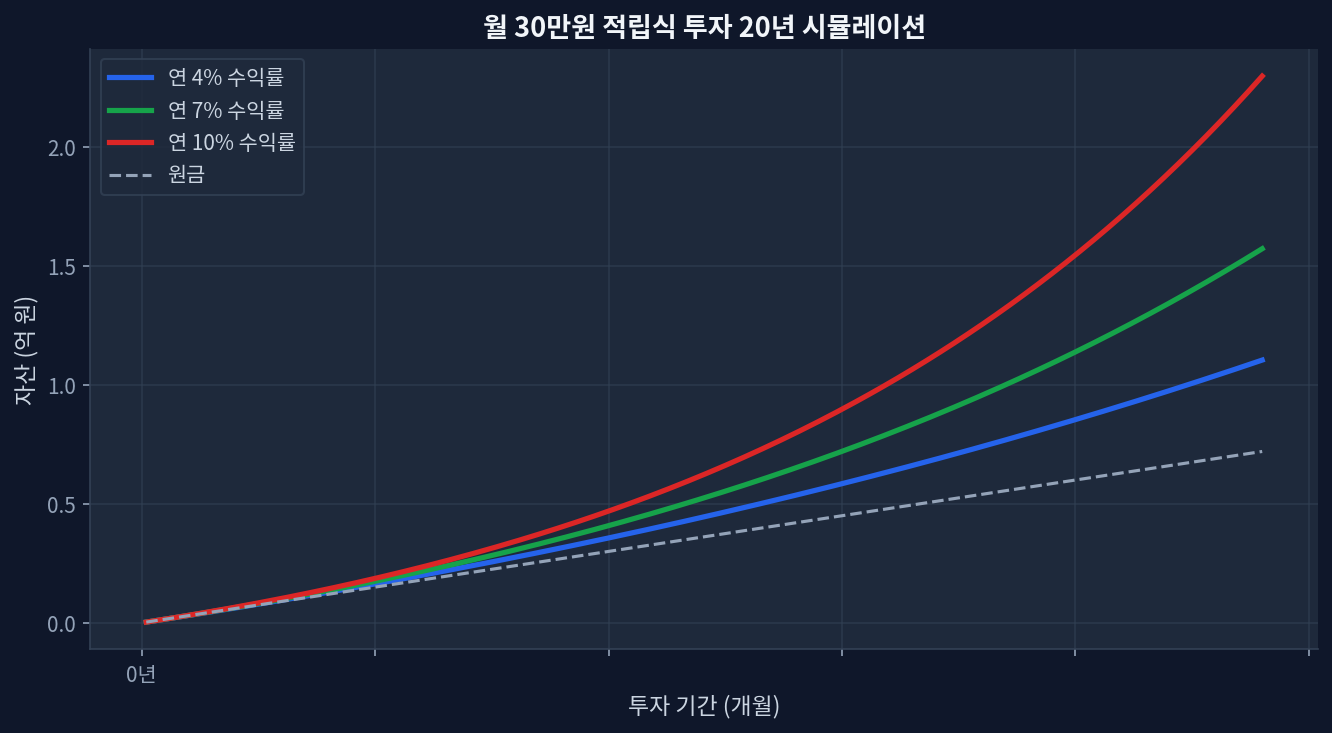
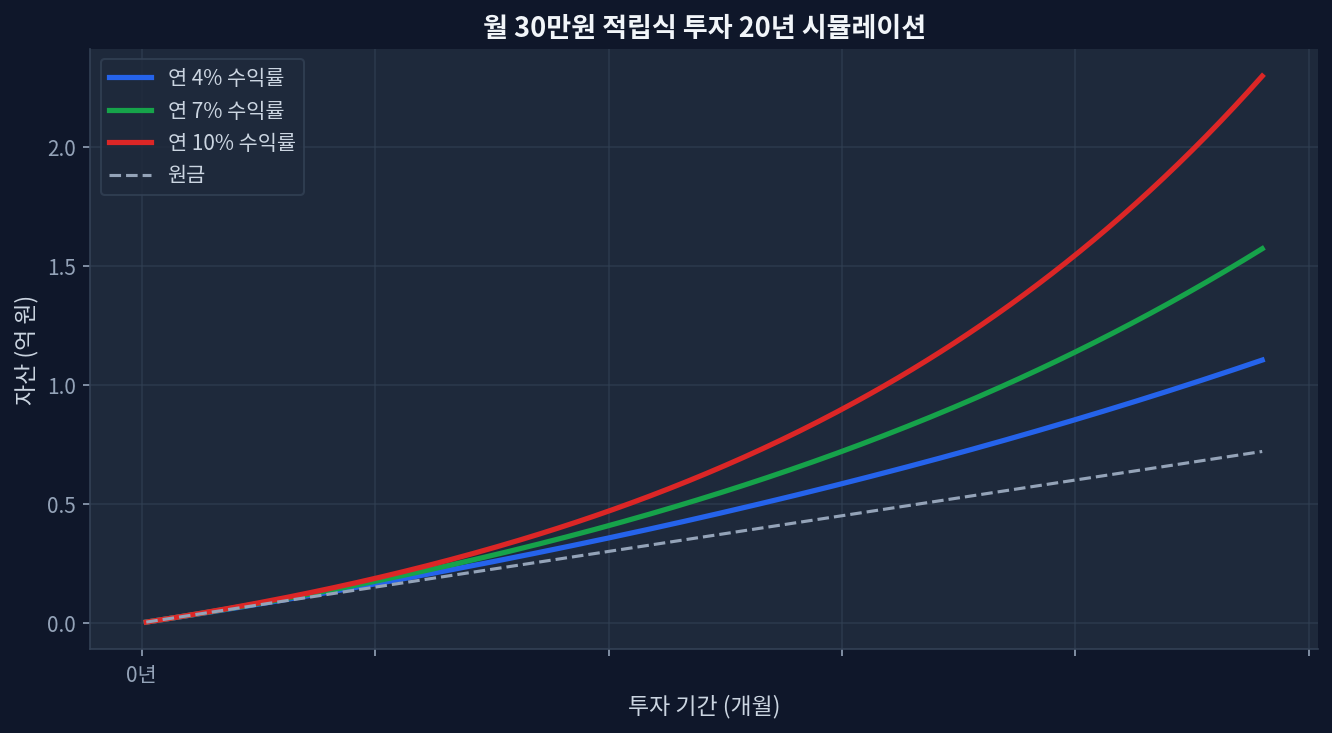
Upfront tax on Roth IRA contributions acts as a drag during prolonged market drawdowns, altering the break-even horizon. Traditional IRA deductions reinvested into taxable accounts can outperform Roth in bracket-compression scenarios. Asset location—placing VTI in Roth and BND in Traditional—adds approximately 40-60 bps of tax alpha annually. The 2020-2026 CAGR of US equities heavily skewed recent analyses toward Roth, hiding sequence-of-returns risks. The Core Mechanics of IRA Taxation Monthly $30K investment 20-year compound growth simulation The chart below shows a 20-year simulation of a $300 monthly investment (4%, 7%, and 10% annually). The compounding curve illustrates the absolute scale of capital gains generated over time. Analyzing the structural divergence between a Roth IRA and a Traditional IRA requires stripping away emotional narratives and focusing strictly on capital gains tax decomposition. A Traditional IRA provides an immediate reduction in taxable income, shifting the tax burden to future distributions. Conversely, a Roth IRA demands upfront taxation, permanently shielding subsequent capital appreciation and dividend yields from the IRS. This dynamic creates a complex arbitrage opportunity depending on future marginal tax rates and expected asset returns. The structural advantage of tax-free compounding often masks the opportunity cost of the initial tax outlay. [IRS.gov] ...

May 18, 2026 · InvestIQs Research
VTI vs VXUS: 15-Year Return Data and the Tax Placement Gap Most Portfolios Ignore

VTI vs VXUS: 15-Year Return Data and the Tax Placement Gap Most Portfolios Ignore

VTI 5Y return: +78.9% vs VXUS +51.1% — but VXUS leads on 1Y at +33.5% vs VTI +27.6%, a reversal worth interrogating.VXUS yields 2.69% vs VTI 1.03% — 2.6x higher income generates greater annual tax drag in taxable accounts.Valuation gap: VTI P/E 28.5 vs VXUS 18.7 — a 52% US premium, historically wide by post-2000 standards.Foreign tax credit from VXUS dividends is recoverable only in taxable brokerage accounts; permanently forfeited inside Roth IRA or 401(k).AUM: VTI $2,202.6B vs VXUS $629.1B — scale gap reflects US home bias more than quality difference. The Performance Split — And the 1-Year Flip That Challenges the Narrative Monthly $30K investment 20-year compound growth simulation The 20-year DCA simulation chart above — modeling $1,500 monthly at 4%, 7%, and 10% annual returns — illustrates how the VTI/VXUS allocation decision quietly reshapes terminal wealth over decades. The multi-year data gives VTI the unambiguous edge. Five-year cumulative: +78.9% vs VXUS’s +51.1%. Three-year: +86.1% vs +66.7%. That 20-30 percentage point spread is not noise — it compounds into a materially different retirement outcome.[Yahoo Finance] ...

May 14, 2026 · InvestIQs Research