Samsung Dividend Reinvestment: Path to 8% Annual Returns Over 5 Years

Samsung Dividend Reinvestment: Path to 8% Annual Returns Over 5 Years

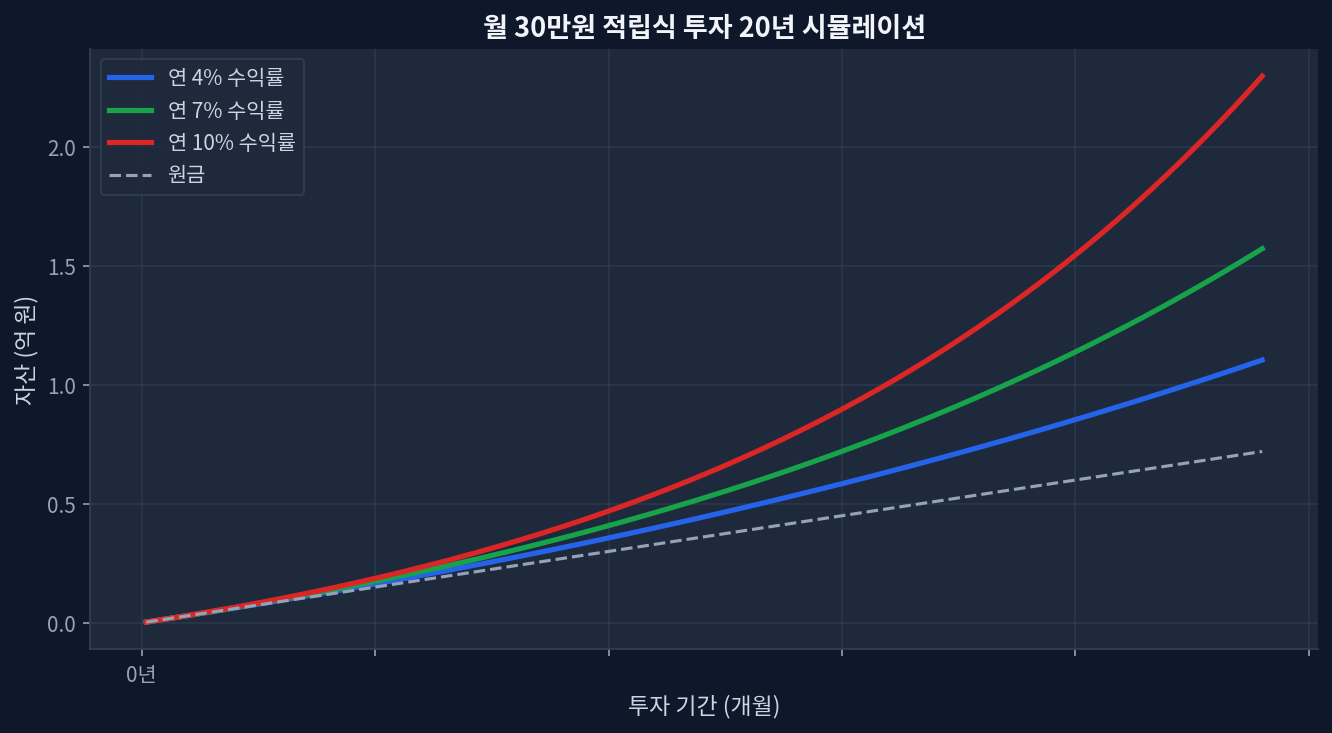
Key TakeawaysSamsung's historical dividend yield averaged 3.2–4.5% over 2020–2026; combined with share-price appreciation, 8% annualized return requires steady market conditionsMonthly $1,500 reinvestment compounds differently across tax-advantaged (Roth/401k) vs. taxable accounts—15% US tax treaty on Korean dividends applies in taxable onlyCurrency risk: KRW/USD volatility can erase 2–3% of gains in down years; hedging costs further reduce net returnsDiscipline matters most—missing dividend reinvestment windows or trading on emotion derails the 8% target more than stock selectionFive-year timeframe is short for equity positions; drawdowns of 20–30% during market corrections are normal and must be endured What 8% Annual Returns Actually Means for Samsung Investors Monthly $30K investment 20-year compound growth simulation Achieving 8% annualized returns on Samsung Electronics over five years requires three moving parts to align: dividend income, share price appreciation, and reinvestment discipline. Most retail investors focus only on the dividend (the visible 3.5% yield) and ignore the harder half—growth and compounding. Samsung’s stock price, denominated in Korean Won, adds an extra layer of complexity: FX exposure can boost returns in strong dollar periods or shred them when the Won appreciates. The math looks clean on a spreadsheet; the reality is messier. ...
June 27, 2026 · InvestIQs Research
Structuring a Late-Stage Retirement Portfolio: Analyzing SCHD's Dividend Efficacy for Investors in Their 50s

Structuring a Late-Stage Retirement Portfolio: Analyzing SCHD's Dividend Efficacy for Investors in Their 50s

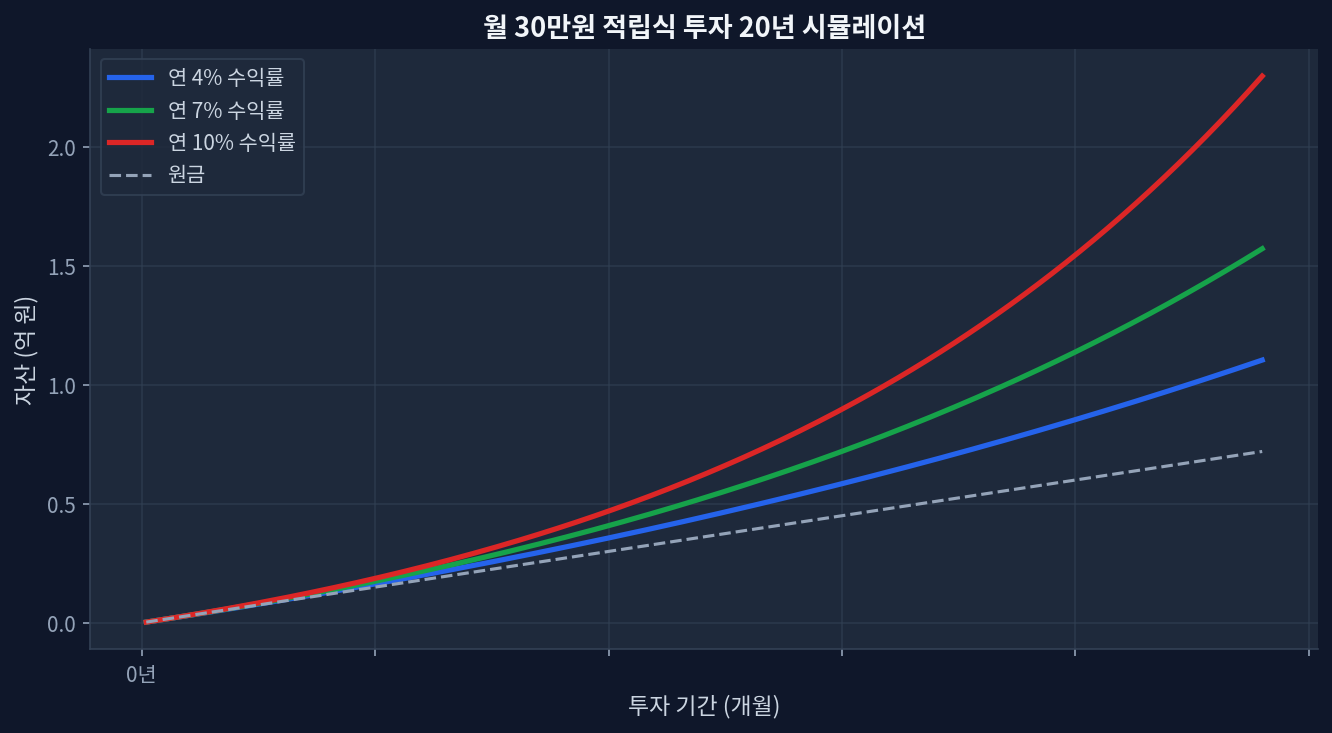
SCHD currently yields 3.21% trading at a 19.5 P/E, presenting a distinct valuation discount against VIG's 1.48% yield and 26.2 P/E. Trailing 5-year data shows VIG (+66.4%) outpacing SCHD (+53.7%), highlighting the persistent growth versus yield tradeoff in modern asset allocation. Short-term momentum favors SCHD, which posted a +31.3% 1-year return, driving the asset to 99.1% of its 52-week range ($32.83). Relying solely on historical dividend growth can lead to an incomplete risk assessment, requiring explicit modeling of market drawdowns and shifting rate environments. Redefining Yield and Growth in the Accumulation Phase Monthly $30K investment 20-year compound growth simulation Observing the chart below, which illustrates a 20-year monthly accumulation simulation, the trajectory of compound growth at varying rates highlights the mathematical reality of long-term investing. For demographic cohorts entering their 50s—similar to the target audience of late-stage planning frameworks—the capital accumulation runway compresses significantly. This structural reality shifts the analytical priority away from maximizing top-line beta exposure toward sequence-of-returns protection and generating reliable cash flow. ...

May 25, 2026 · InvestIQs Research
2024 401(k) Contribution Limits: Tax Bracket Impact Simulation & Volatility Risks

2024 401(k) Contribution Limits: Tax Bracket Impact Simulation & Volatility Risks

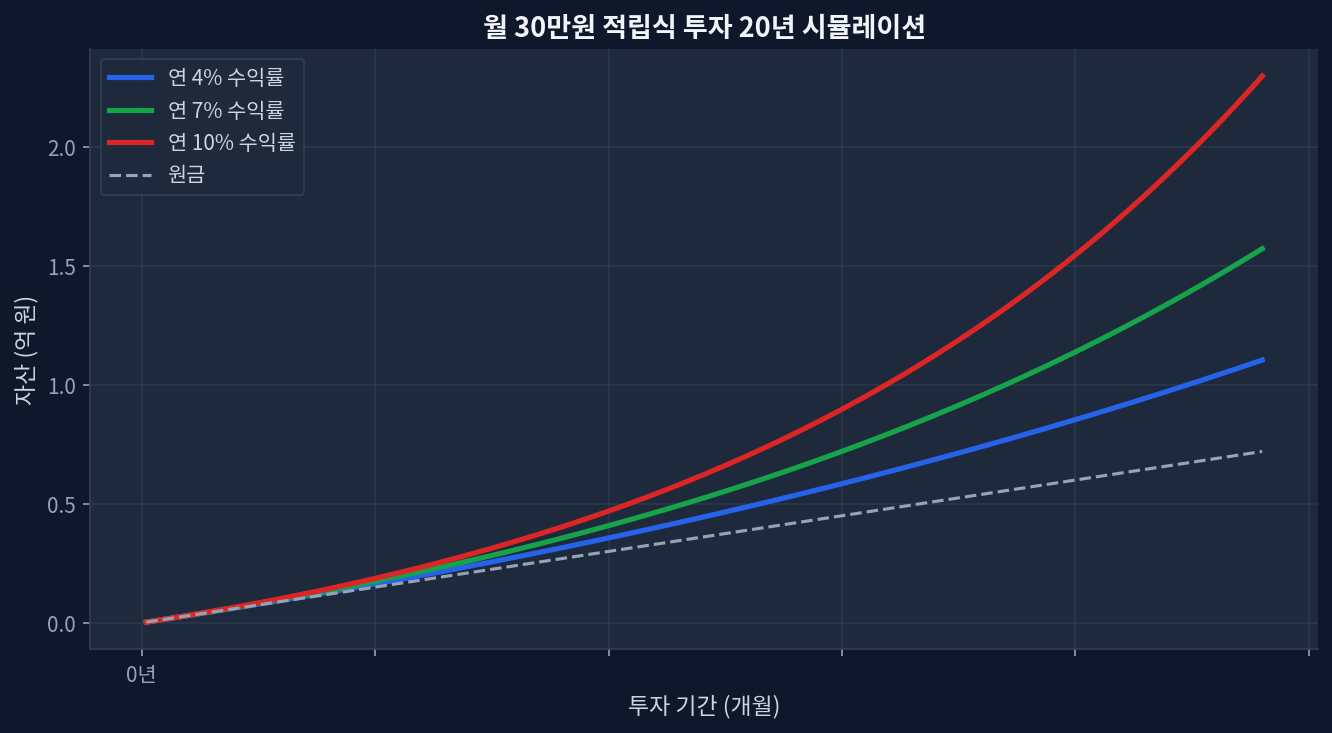
The 2024 401(k) contribution limit rose to $23,000, altering marginal tax exposure for the 24% and 32% brackets.Pre-tax contributions act as a volatility hedge against current high tax rates, deferring liability to a historically uncertain future bracket.Data indicates the 2020-2026 CAGR stood at 12.3% for major US indices, accelerating the tax cliff risk at RMD age.This diverges from the market narrative on maximizing pre-tax accounts blindly without considering post-2025 legislative tax hikes. Mapping the 2024 Limits Against Tax Volatility Monthly $30K investment 20-year compound growth simulation The 2024 IRS adjustments pushed the standard 401(k) contribution limit to $23,000. Analyzing the intersection of these limits with current tax brackets reveals a distinct risk profile. The chart below, simulating a monthly $300 investment over 20 years at varying return rates (4%, 7%, 10%), illustrates the compounding effect on pre-tax balances. ...

May 19, 2026 · InvestIQs Research
Roth IRA vs Traditional IRA: 5-Scenario Capital Gains Tax Decomposition

Roth IRA vs Traditional IRA: 5-Scenario Capital Gains Tax Decomposition

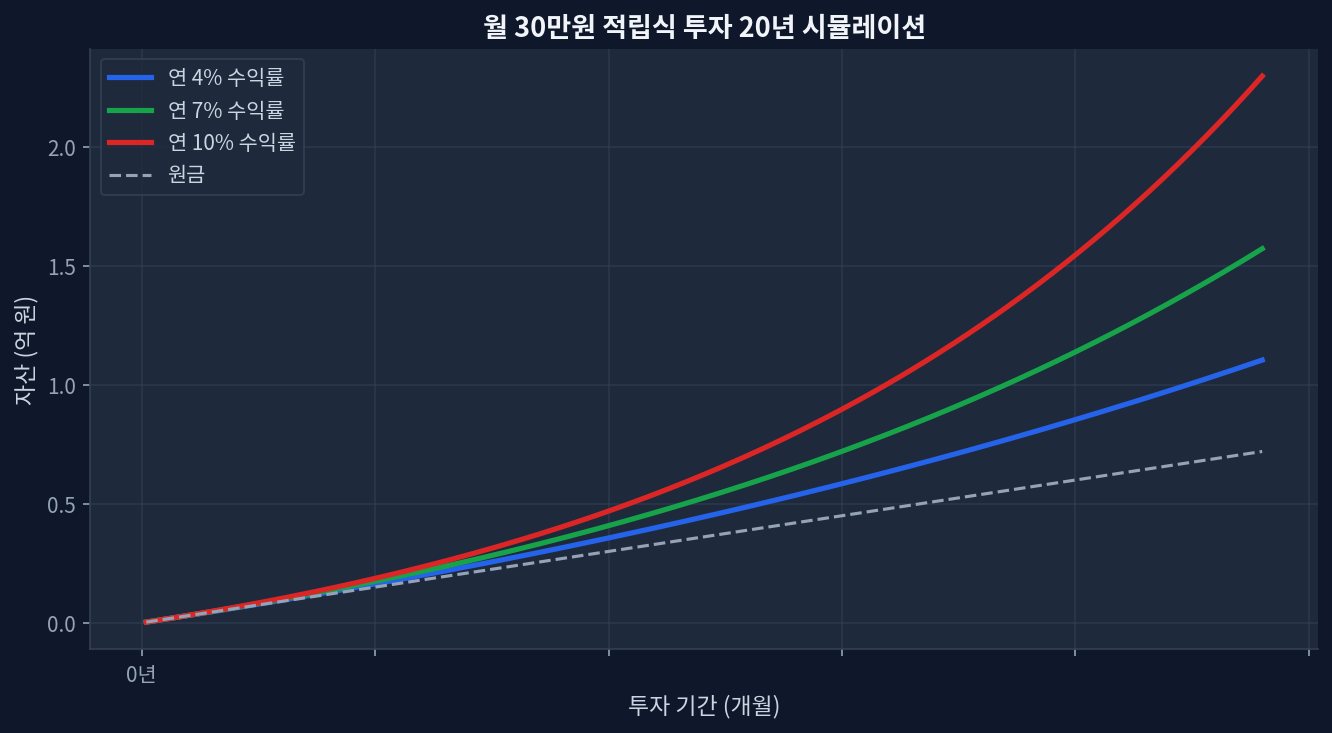
Upfront tax on Roth IRA contributions acts as a drag during prolonged market drawdowns, altering the break-even horizon. Traditional IRA deductions reinvested into taxable accounts can outperform Roth in bracket-compression scenarios. Asset location—placing VTI in Roth and BND in Traditional—adds approximately 40-60 bps of tax alpha annually. The 2020-2026 CAGR of US equities heavily skewed recent analyses toward Roth, hiding sequence-of-returns risks. The Core Mechanics of IRA Taxation Monthly $30K investment 20-year compound growth simulation The chart below shows a 20-year simulation of a $300 monthly investment (4%, 7%, and 10% annually). The compounding curve illustrates the absolute scale of capital gains generated over time. Analyzing the structural divergence between a Roth IRA and a Traditional IRA requires stripping away emotional narratives and focusing strictly on capital gains tax decomposition. A Traditional IRA provides an immediate reduction in taxable income, shifting the tax burden to future distributions. Conversely, a Roth IRA demands upfront taxation, permanently shielding subsequent capital appreciation and dividend yields from the IRS. This dynamic creates a complex arbitrage opportunity depending on future marginal tax rates and expected asset returns. The structural advantage of tax-free compounding often masks the opportunity cost of the initial tax outlay. [IRS.gov] ...

May 18, 2026 · InvestIQs Research