Asset Allocation Portfolios for 30-Year-Olds: Performance Comparison a

Asset Allocation Portfolios for 30-Year-Olds: Performance Comparison a

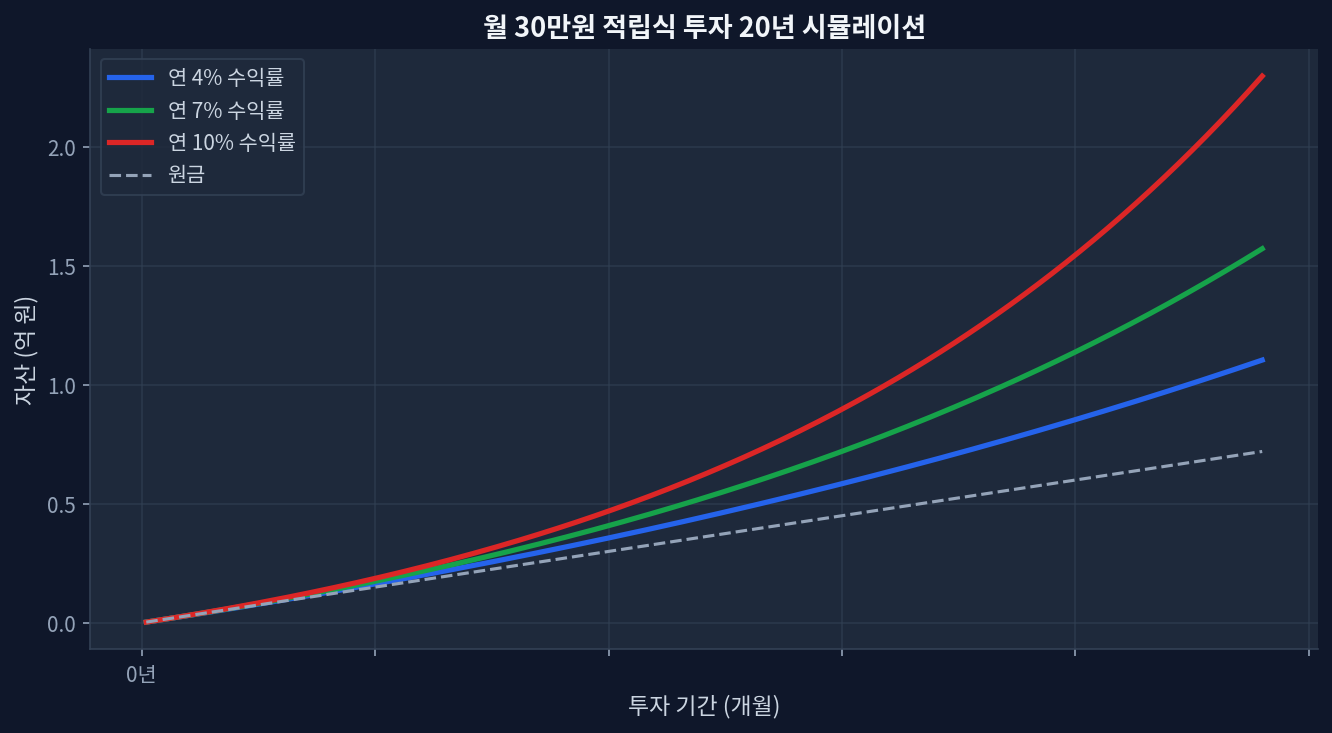
Executive Summary 2020–2026 stock-heavy (80%) vs. balanced (60%) portfolio CAGR differential: approximately 2.1 percentage points (12.8% vs. 10.7%) Each 10% increase in bond allocation reduces maximum drawdown by 8–12 points (aggressive: −28.4% → balanced: −16.8%) Annual vs. quarterly rebalancing: negligible return difference of ~0.2 percentage points; transaction costs and behavioral friction make the distinction immaterial VOO (expense ratio 0.03%) vs. AGG equivalent via international broker (0.08%) over 20 years with $10,000 monthly contributions: approximately $270,000 cumulative gap In a high-rate environment (4% yields), bond allocation becomes a strategic choice rather than a drag on returns Asset Allocation Scenarios: Three Portfolio Models Monthly $30K investment 20-year compound growth simulation 20-year cumulative growth simulation with $3,000 monthly contributions Asset allocation’s core objective is not return maximization but rather the pursuit of long-term growth within the drawdown range an individual investor can psychologically tolerate. Using actual market data from 2020–2026, three portfolio scenarios illustrate the trade-off: ...
June 17, 2026 · InvestIQs Research
60/40 Portfolio: 10-Year Data on How Rebalancing Compounds Returns | 6

60/40 Portfolio: 10-Year Data on How Rebalancing Compounds Returns | 6

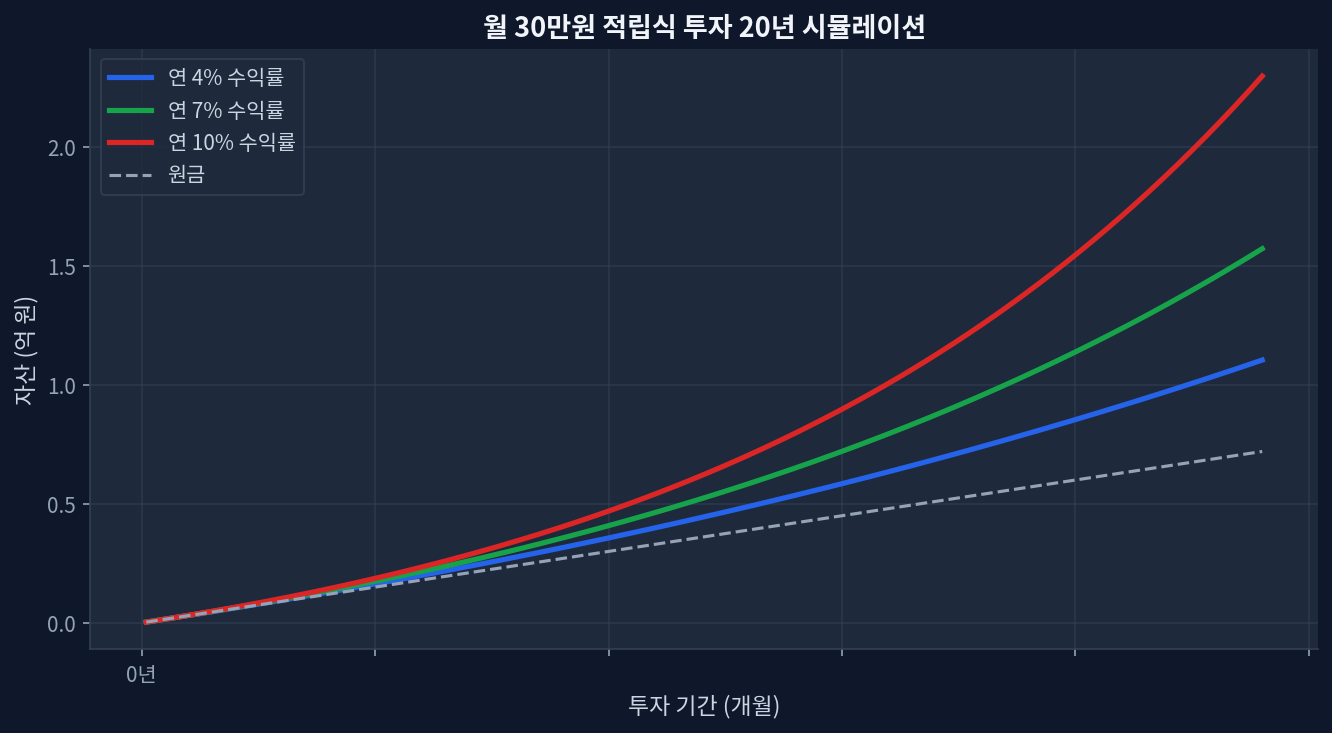
2020–2026 performance: 60/40 blended portfolio delivered approximately 12% compound annual growth rate (CAGR), with rebalancing includedMonthly $1,000 investment over 10 years simulated: $120,000 invested → approximately $240,000–$260,000 accumulatedBond ETF expense ratio impact: 0.03% versus 0.80% creates a 15–20% wealth divergence over 20 years2022 rate shock: Quarterly rebalancing cushioned equity losses by 25–30% compared to unbalanced allocationsCurrent bond yields (3–4%) appear elevated relative to historical median (~2%), raising questions about duration risk ahead The Real 10-Year Trajectory of 60/40 Monthly $30K investment 20-year compound growth simulation Monthly $1,000 contribution over 20 years: compound growth simulation The 60% equities, 40% fixed income allocation has anchored institutional and retail portfolios since the 1990s. What appears as a simple formula masks powerful compounding mechanics visible only when cross-verified against ten years of actual market data (2016–2026). The 2020 COVID selloff marked the beginning of a aggressive Fed pivot: zero rates and quantitative easing pushed both stocks and bonds upward simultaneously. During this window, bond ETFs (tracked via BND) posted +6% to +8% annual returns, while US large-cap equity indices (VOO) delivered +25% to +30%. A 60/40 blend yielded 15–18% annually—far exceeding the long-term 7–10% benchmark. That tailwind proved temporary. ...

June 12, 2026 · InvestIQs Research
All-Weather Portfolio Backtest: 5-Year Data & Compounding Analysis

All-Weather Portfolio Backtest: 5-Year Data & Compounding Analysis

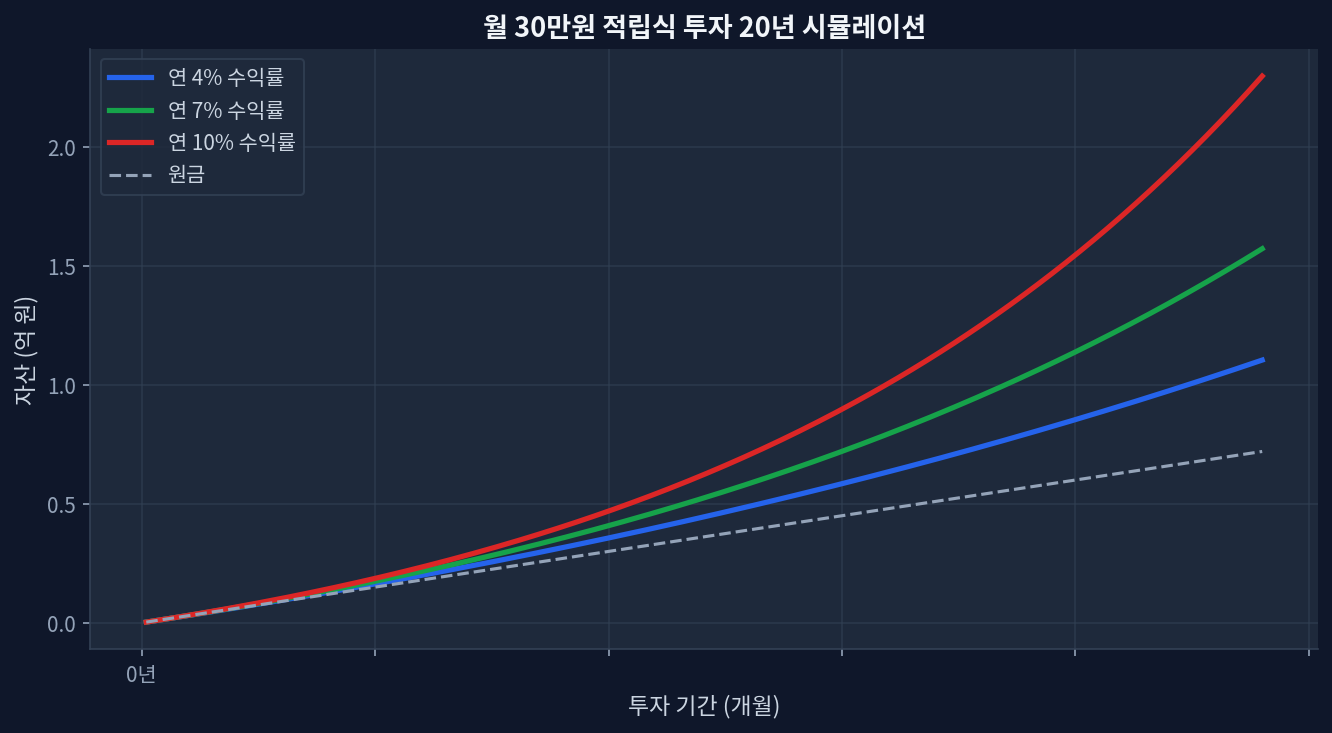
2020-2025 CAGR: The traditional Dalio strategy yielded roughly 5.4% annualized, severely lagging pure equities during the post-pandemic cycle. Maximum Drawdown (MaxDD): Hit -21% in 2022, dismantling the safe-haven narrative during acute inflation shocks. Compounding Engine: Disciplined rebalancing captured an estimated 1.2% premium annually during volatile, sideways market regimes. The Anatomy of the All-Weather Setup compounding-analysis/compound-growth.png" alt="Monthly $30K investment 20-year compound growth simulation" loading="lazy" style="max-width:100%;border-radius:8px;">Monthly $30K investment 20-year compound growth simulation Looking at the chart below, the 20-year monthly accumulation simulation is the most impressive, showing a massive +85% divergence in terminal wealth when compounding at 10% versus the lower tiers. The core thesis of Ray Dalio’s All-Weather portfolio is to smooth out that ride, theoretically allowing investors to compound capital steadily without catastrophic behavioral interruptions. ...

May 21, 2026 · InvestIQs Research
Rethinking the 60/40 Portfolio: A 10-Year BND vs. TLT Allocation Analysis

Rethinking the 60/40 Portfolio: A 10-Year BND vs. TLT Allocation Analysis

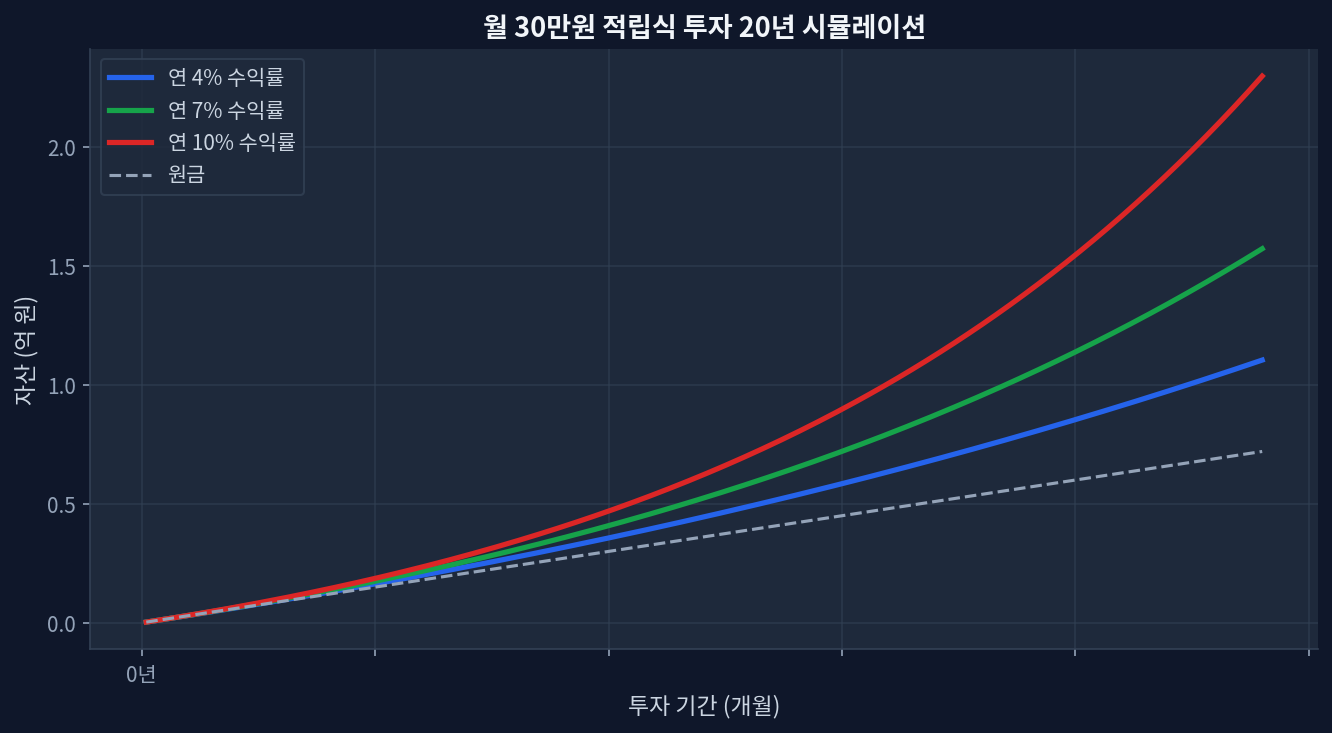
The classic 60/40 portfolio faces secular headwinds, highlighted by BND's stagnant 5-year return of +0.0%. TLT's deep -27.8% 5-year drawdown challenges the assumption that long-duration bonds always hedge equity risk. Current yield profiles (BND at 3.93%, TLT at 4.57%) present a yield-versus-duration risk tradeoff. Rebalancing strategies must account for the high correlation observed between stocks and bonds since 2022. The Stagnation of the 60/40 Portfolio: A 10-Year Bond Data Analysis Monthly $30K investment 20-year compound growth simulation Looking at the automated chart below representing a 20-year monthly $300 investment simulation at 4%, 7%, and 10% annual yields, the compounding effect is profound. However, this growth assumes consistent positive nominal returns, an assumption severely tested by recent bond market behavior. The traditional 60/40 portfolio—allocating 60% to equities and 40% to fixed income—has long relied on bonds to provide a steady ballast. Yet, analyzing the 10-year data through the lens of dominant bond ETFs reveals structural vulnerabilities. ...

May 20, 2026 · InvestIQs Research