April 30, 2026 US Market Close: S&P 500 $711.58 -0.02%, Nasdaq +0.61%

⚠️ Daily market snapshot — informational only This article summarizes publicly available yfinance data. It is not investment advice and does not recommend buying or selling any security. All investment decisions and outcomes are your own responsibility. Key TakeawaysS&P 500 $711.58 (-0.02%), Nasdaq +0.61%, VIX 18.81 (+5.50%)Leaders: XLE, XLK, XLF / Laggards: XLU, XLB, XLVMixed tape — defensives lag while energy and tech outperform Summary: S&P 500 $711.58 -0.02%, Nasdaq +0.61%, VIX 18.81. Leaders: XLE, XLK, XLF / Laggards: XLU, XLB, XLV. ...
April 30, 2026 · InvestIQs Editorial

April 29, 2026 US Market Close: S&P 500 $711.69 -0.49%, Nasdaq -1.01%

⚠️ Daily market snapshot — informational only This article summarizes publicly available yfinance data. It is not investment advice and does not recommend buying or selling any security. All investment decisions and outcomes are your own responsibility. Key Summary S&P 500 closed at $711.69 (-0.49%) and Nasdaq-100 lost -1.01%, with the VIX easing to 17.83 (-1.05%). Sector leaders were defensive — XLE, XLRE, XLP — while growth proxies XLK, XLI, XLB lagged the tape. Russell 2000 (IWM) -1.17% confirms small caps absorbed the brunt of risk-off rotation. Watch 10Y Treasury yield, DXY, and upcoming CPI/PCE prints for the next directional cue. Summary: S&P 500 $711.69 -0.49%, Nasdaq -1.01%, VIX 17.83. Leaders: XLE, XLRE, XLP / Laggards: XLK, XLI, XLB. ...

April 29, 2026 · InvestIQs Editorial

April 28, 2026 US Market Close: S&P 500 $715.17 +0.00%, Nasdaq +0.00%

⚠️ Daily market snapshot — informational only This article summarizes publicly available yfinance data. It is not investment advice and does not recommend buying or selling any security. All investment decisions and outcomes are your own responsibility. Key Summary S&P 500 closed flat at $715.17 (+0.00%) and Nasdaq-100 finished unchanged, with the VIX easing to 18.02 (-3.69%). Cyclical leadership: XLF, XLC, XLK lifted the tape, while defensive XLP, XLRE, and consumer-cyclical XLY trailed. Russell 2000 (IWM) +0.18% shows small caps held up despite the broader index stalemate. The pullback in implied volatility points to a wait-and-see posture ahead of upcoming macro releases. Summary: S&P 500 $715.17 +0.00%, Nasdaq +0.00%, VIX 18.02. Leaders: XLF, XLC, XLK / Laggards: XLP, XLRE, XLY. ...

April 28, 2026 · InvestIQs Editorial

April 27, 2026 US Market Intraday: First 30 min S&P 500 +0.07%, Nasdaq -0.09%

⚠️ Daily market snapshot — informational only This article summarizes publicly available yfinance data. It is not investment advice and does not recommend buying or selling any security. All investment decisions and outcomes are your own responsibility. Key Summary First 30 minutes: S&P 500 +0.07% from open, Nasdaq -0.09%, with VIX rising 2.67% to 19.07. Defensive plus financial leadership — XLV, XLF, XLE — while growth (XLK -0.45%) trails. Small caps (IWM) effectively flat at +0.03%; gap classification reads as gap_flat across major indices. Watch 10:00 ET data prints, mega-cap follow-through, and whether VIX retraces below 19 to confirm a constructive open. Summary: S&P 500 +0.07%, Nasdaq -0.09%, VIX 19.07. Gap: gap_flat. Leaders: XLV, XLF, XLE / Laggards: XLK, XLB, XLY. ...

April 27, 2026 · InvestIQs Editorial
TQQQ’s 5-Year Drawdown and Volatility Breakdown: Where 3x Lagged 2x

TQQQ’s 5-Year Drawdown and Volatility Breakdown: Where 3x Lagged 2x

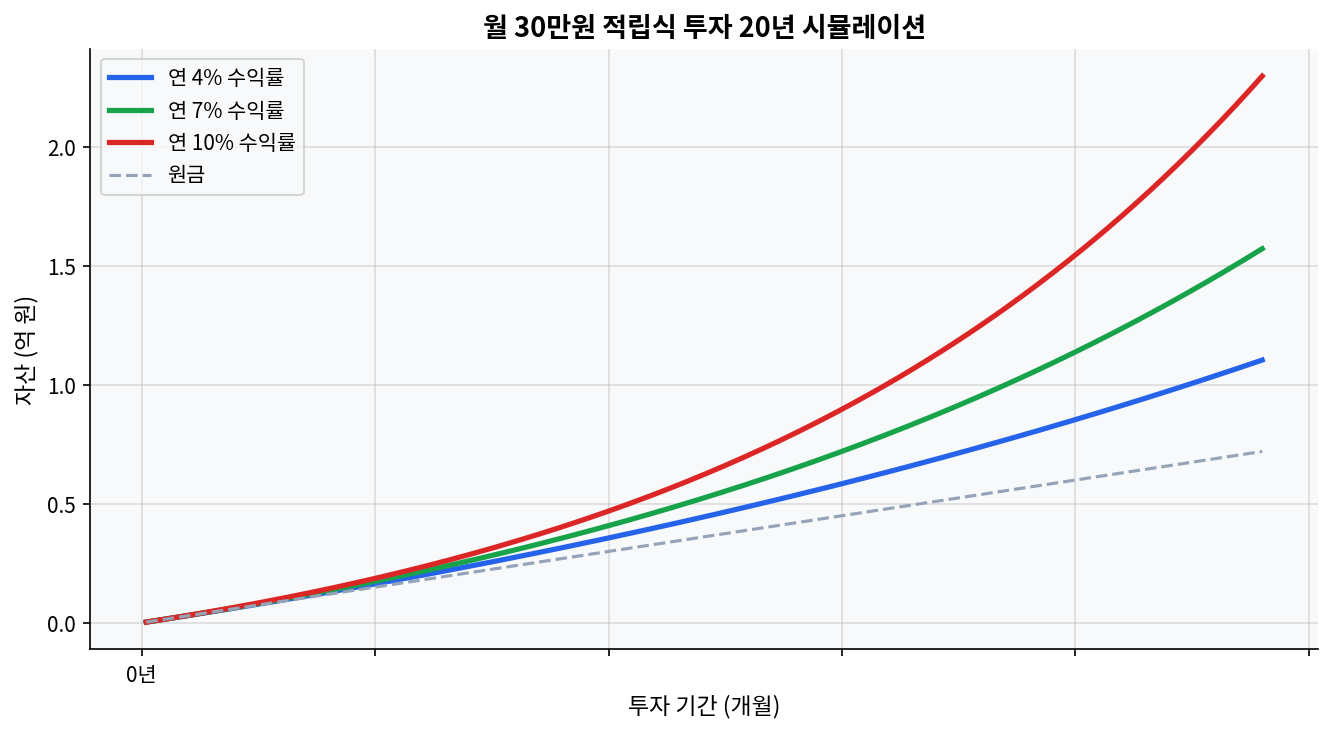
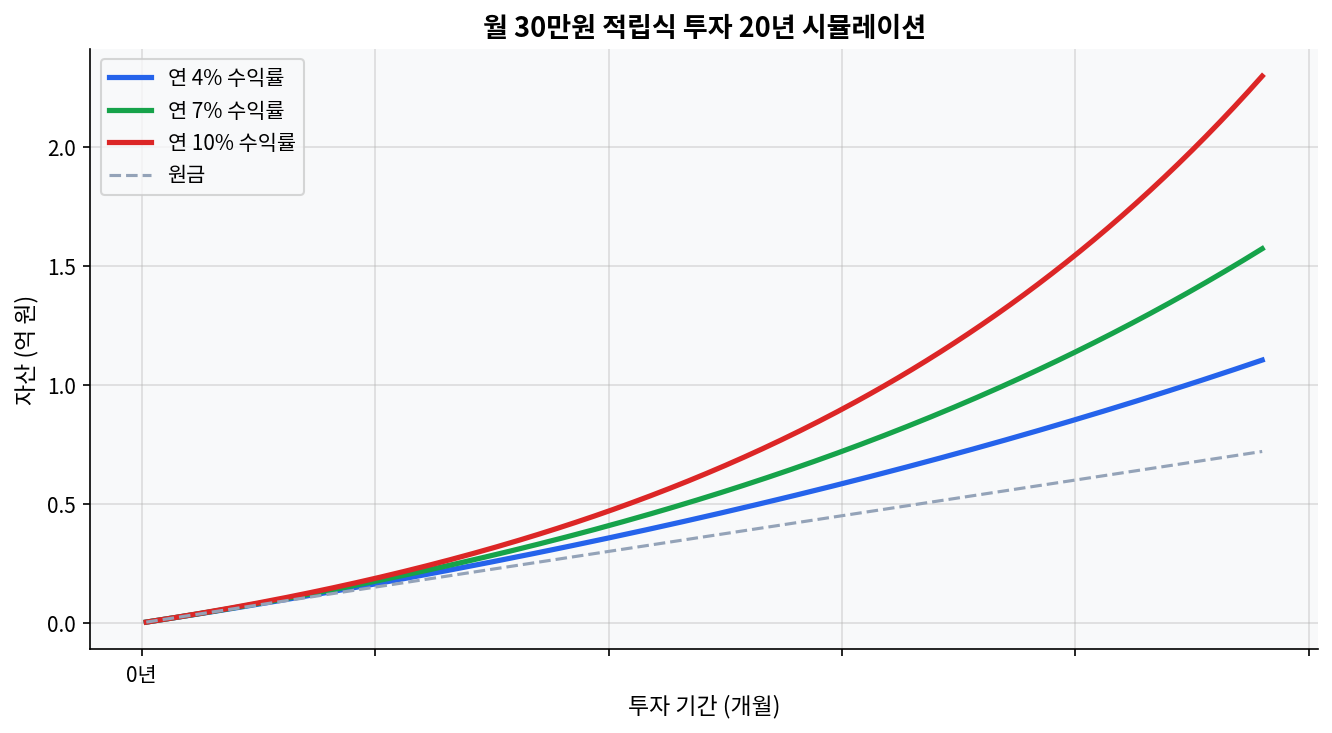
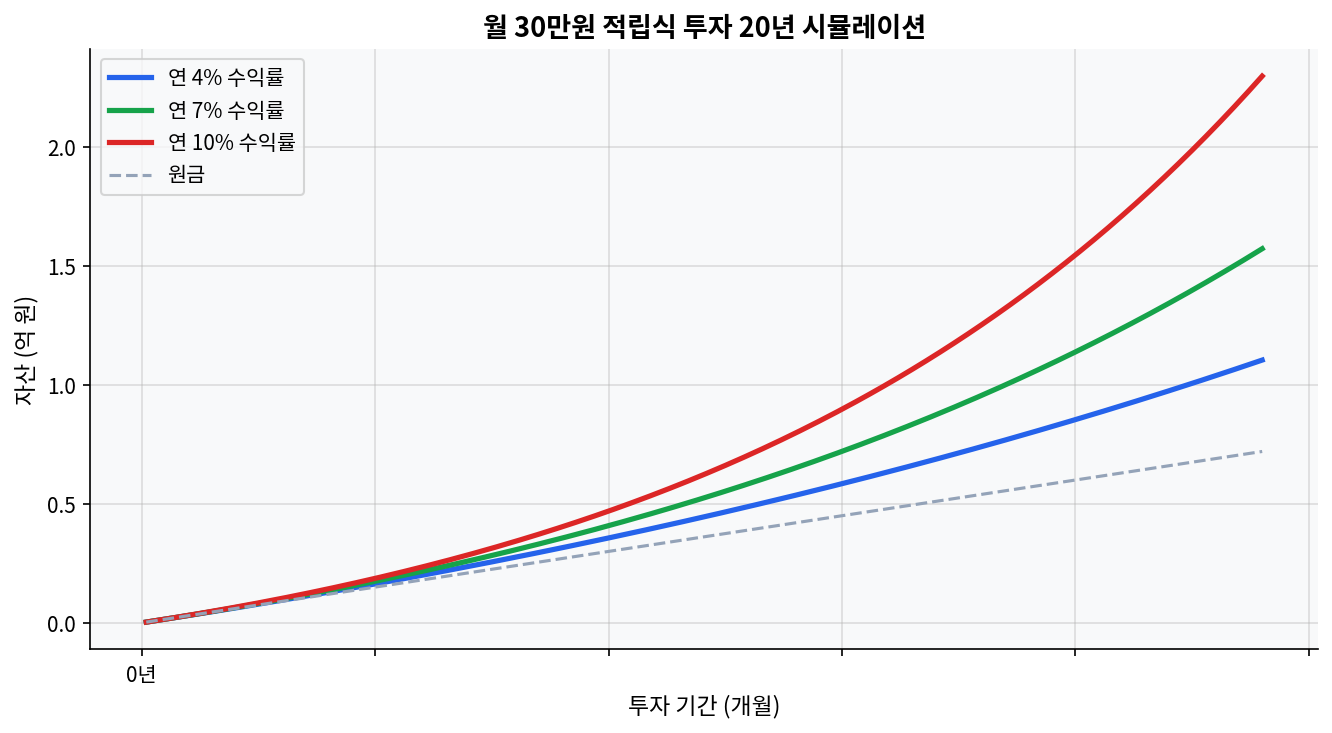
As of 2026-04-21, TQQQ’s five-year total return was 120.40%, with a CAGR of 16.57%.As of 2026-03-31, TQQQ’s five-year maximum drawdown was 81.65%, versus 35.12% for QQQ, or 2.33x deeper.Five-year annualized monthly volatility came in at 61.28% for TQQQ, 20.23% for QQQ, and 40.61% for QLD.Over the same five-year window, QLD outpaced TQQQ with a 137.48% total return and an 18.77% CAGR.Dividend yield was roughly 0.53% for TQQQ, 0.15% for QLD, and 0.43% for QQQ, which is why the real story in leveraged ETFs is path dependence, not cash flow. The Two Charts Say It First Monthly investment 20-year compound growth simulation Comparison of how ETF fee differences affect long-term wealth The first chart shows the 20-year wealth gap between a 0.05% ETF fee and a 1.0% fee. The second shows how monthly investing of $300 compounds very differently at 4%, 7%, and 10% over time. In a TQQQ discussion, those charts are not background material. For leveraged ETFs, costs and path shape the capital curve faster than the return table suggests. Even when TQQQ rallies hard between 2020 and 2026, the first question is how much damage a single 2022-style crash can do to the long-term line. ...

April 25, 2026
QQQ vs SPY 10-Year Regression: Tech Concentration vs Diversification

QQQ vs SPY 10-Year Regression: Tech Concentration vs Diversification

QQQ sits at $651.42 with a 1-year return of +44.0%, while SPY sits at $708.45 with a 1-year return of +33.8%.The 3-year cumulative gap is 30.2 percentage points: QQQ at +108.0% versus SPY at +77.8%.The 5-year cumulative gap is 15.4 percentage points: QQQ at +98.1% versus SPY at +82.7%.SPY still pays more income, with a 1.04% dividend yield versus QQQ at 0.43%, or 2.4 times as much cash yield.On an implied 5-year CAGR basis, QQQ is roughly 14.6% and SPY roughly 12.8%, which means the spread exists, but it is not huge enough to ignore regime risk. Why the 20-year savings curve matters more than the share price Monthly investment 20-year compound growth simulation The first mistake in comparing QQQ and SPY is to stare at the price tags. QQQ at $651.42 and SPY at $708.45 look like two expensive symbols, but share price is not the signal. The return path is. The 20-year monthly 300,000-won simulation inserted below this section makes the same point in a cleaner way: at 4%, 7%, and 10%, the ending values do not rise in a straight line. They accelerate. That is the compounding effect that turns a small annual edge into a large decade gap. ...

April 24, 2026
TQQQ Five-Year Drawdown and Volatility Decomposition: When 3x Trails 2x

TQQQ Five-Year Drawdown and Volatility Decomposition: When 3x Trails 2x

As of 2026-04-21, TQQQ’s 5-year total return was 120.40%, with a CAGR of 16.57%.As of 2026-03-31, TQQQ’s 5-year maximum drawdown was 81.65%, compared with 35.12% for QQQ.5-year annualized monthly volatility was 61.28% for TQQQ, 20.23% for QQQ, and 40.61% for QLD.Over the same 5-year window, QLD outperformed TQQQ with a total return of 137.48% and a CAGR of 18.77%.Dividend yield sat at 0.53% for TQQQ, 0.15% for QLD, and 0.43% for QQQ. For leveraged ETFs, the core driver is not cash flow but path dependency. The Two Charts Say the First Thing Comparison of how ETF fee differences affect long-term returns The first chart shows the long-run asset gap between 0.05% and 1.0% ETF fees over 20 years. The second shows how monthly $300 contributions diverge over time at 4%, 7%, and 10% annual returns. In the TQQQ discussion, those two charts are not background noise. For leveraged ETFs, cost and path shape the equity curve faster than the headline return table suggests. Even if TQQQ posts a strong 2020-2026 run, a single 2022-style collapse can damage the long-run profile in ways that are hard to reverse. ...

April 24, 2026