The Hidden Cost of 3x Leverage: QQQ vs TQQQ in a -30% Crash

The Hidden Cost of 3x Leverage: QQQ vs TQQQ in a -30% Crash

The Hidden Cost of 3x Leverage: QQQ vs [drawdown](/en/study/tqqq-five-year-<a href=)-and-volatility-decomposition-when-3x-trails-2x/">TQQQ in a -30% Crash QQQ delivered +40.7% over the past 12 months but now sits 96.4% within its 52-week range — near the top TQQQ's 3x leverage amplifies both gains and losses; in a -30% Nasdaq downturn, QQQ holders face -30% drawdown while TQQQ could lose -80% or more due to rebalancing drag Daily rebalancing in TQQQ introduces a "volatility tax" that erodes long-term returns, especially in sideways markets QQQ's P/E ratio of 34.0 reflects elevated valuation; TQQQ compounds this risk with leverage Scenario data shows a tech worker investing $1,500 monthly since 2020 faces asymmetric downside with leverage — protection requires hedging or cash reserves The Nasdaq has roared higher for most of 2024 and into 2025, with QQQ gains posting +40.7% over the past year. Yet that return masks an uncomfortable truth: the index now trades at a P/E ratio of 34.0, sits at 96.4% of its 52-week high, and leaves little room for error. For those tempted by the allure of leverage, the promise of 3x returns via TQQQ feels irresistible. But leverage works both ways, and the math of a -30% correction reveals why many leverage-chasing investors end up with catastrophic losses. ...
June 19, 2026 · InvestIQs Research

June 19, 2026 US Market Close: S&P 500 $746.74 +0.78%, Nasdaq +2.51%

⚠️ Daily market snapshot — informational only This article summarizes publicly available yfinance data. It is not investment advice and does not recommend buying or selling any security. All investment decisions and outcomes are your own responsibility. 🧭 Market Sentiment: Greed 😊 (56/100) ██████░░░░ Estimated from VIX 16.40 📊 Market Breadth · 🟡 sectors 5/11 advancing (45%) · 🟢 Mag7 7/7 advancing (100%) Summary: S&P 500 $746.74 +0.78%, Nasdaq +2.51%, VIX 16.40. Leaders: XLK, XLY, XLI / Laggards: XLE, XLF, XLV. ...

June 19, 2026 · InvestIQs Editorial

June 18, 2026 US Market Close: S&P 500 $740.96 -1.25%, Nasdaq -1.01%

⚠️ Daily market snapshot — informational only This article summarizes publicly available yfinance data. It is not investment advice and does not recommend buying or selling any security. All investment decisions and outcomes are your own responsibility. 🧭 Market Sentiment: Neutral 😐 (53/100) █████░░░░░ Estimated from VIX 18.44 📊 Market Breadth · 🔴 sectors 0/11 advancing (0%) · 🔴 Mag7 0/7 advancing (0%) Summary: S&P 500 $740.96 -1.25%, Nasdaq -1.01%, VIX 18.44. Leaders: XLI, XLK, XLF / Laggards: XLC, XLY, XLRE. ...

June 18, 2026 · InvestIQs Editorial

June 17, 2026 US Market Close: S&P 500 $750.33 -0.60%, Nasdaq -1.90%

⚠️ Daily market snapshot — informational only This article summarizes publicly available yfinance data. It is not investment advice and does not recommend buying or selling any security. All investment decisions and outcomes are your own responsibility. 🧭 Market Sentiment: Neutral 😐 (54/100) █████░░░░░ Estimated from VIX 16.41 📊 Market Breadth · 🟢 sectors 8/11 advancing (73%) · 🟡 Mag7 3/7 advancing (43%) Summary: S&P 500 $750.33 -0.60%, Nasdaq -1.90%, VIX 16.41. Leaders: XLF, XLU, XLI / Laggards: XLK, XLE, XLY. ...

June 17, 2026 · InvestIQs Editorial

June 16, 2026 US Market Close: S&P 500 $754.83 +1.76%, Nasdaq +3.14%

⚠️ Daily market snapshot — informational only This article summarizes publicly available yfinance data. It is not investment advice and does not recommend buying or selling any security. All investment decisions and outcomes are your own responsibility. 🧭 Market Sentiment: Greed 😊 (58/100) ██████░░░░ Estimated from VIX 16.20 📊 Market Breadth · 🟢 sectors 7/11 advancing (64%) · 🟢 Mag7 7/7 advancing (100%) Summary: S&P 500 $754.83 +1.76%, Nasdaq +3.14%, VIX 16.20. Leaders: XLK, XLY, XLI / Laggards: XLE, XLRE, XLV. ...

June 16, 2026 · InvestIQs Editorial

June 15, 2026 US Market Close: S&P 500 $741.75 +0.54%, Nasdaq +0.59%

⚠️ Daily market snapshot — informational only This article summarizes publicly available yfinance data. It is not investment advice and does not recommend buying or selling any security. All investment decisions and outcomes are your own responsibility. 🧭 Market Sentiment: Greed 😊 (56/100) ██████░░░░ Estimated from VIX 17.68 📊 Market Breadth · 🟢 sectors 9/11 advancing (82%) · 🟡 Mag7 4/7 advancing (57%) Summary: S&P 500 $741.75 +0.54%, Nasdaq +0.59%, VIX 17.68. Leaders: XLB, XLF, XLU / Laggards: XLC, XLV, XLY. ...

June 15, 2026 · InvestIQs Editorial

June 14, 2026 US Market Close: S&P 500 $741.75 +0.54%, Nasdaq +0.59%

⚠️ Daily market snapshot — informational only This article summarizes publicly available yfinance data. It is not investment advice and does not recommend buying or selling any security. All investment decisions and outcomes are your own responsibility. 🧭 Market Sentiment: Greed 😊 (56/100) ██████░░░░ Estimated from VIX 17.68 📊 Market Breadth · 🟢 sectors 9/11 advancing (82%) · 🟡 Mag7 4/7 advancing (57%) Summary: S&P 500 $741.75 +0.54%, Nasdaq +0.59%, VIX 17.68. Leaders: XLB, XLF, XLU / Laggards: XLC, XLV, XLY. ...

June 14, 2026 · InvestIQs Editorial

2026년 6월 2주차 (6월 8일~12일) US Market Weekly Wrap: S&P 500 -0.22%, Nasdaq +0.49%

⚠️ Daily market snapshot — informational only This article summarizes publicly available yfinance data. It is not investment advice and does not recommend buying or selling any security. All investment decisions and outcomes are your own responsibility. 🧭 Market Sentiment: Neutral 😐 (55/100) ██████░░░░ Estimated from VIX 0.00 Summary: S&P 500 -0.22%, Nasdaq +0.49%, VIX 17.68. Leaders: XLP, XLB, XLF / Laggards: XLE, XLK, XLC. ...

June 13, 2026 · InvestIQs Editorial
TIGER & QQQ: 5-Year Tech Concentration Returns Under the Microscope

TIGER & QQQ: 5-Year Tech Concentration Returns Under the Microscope

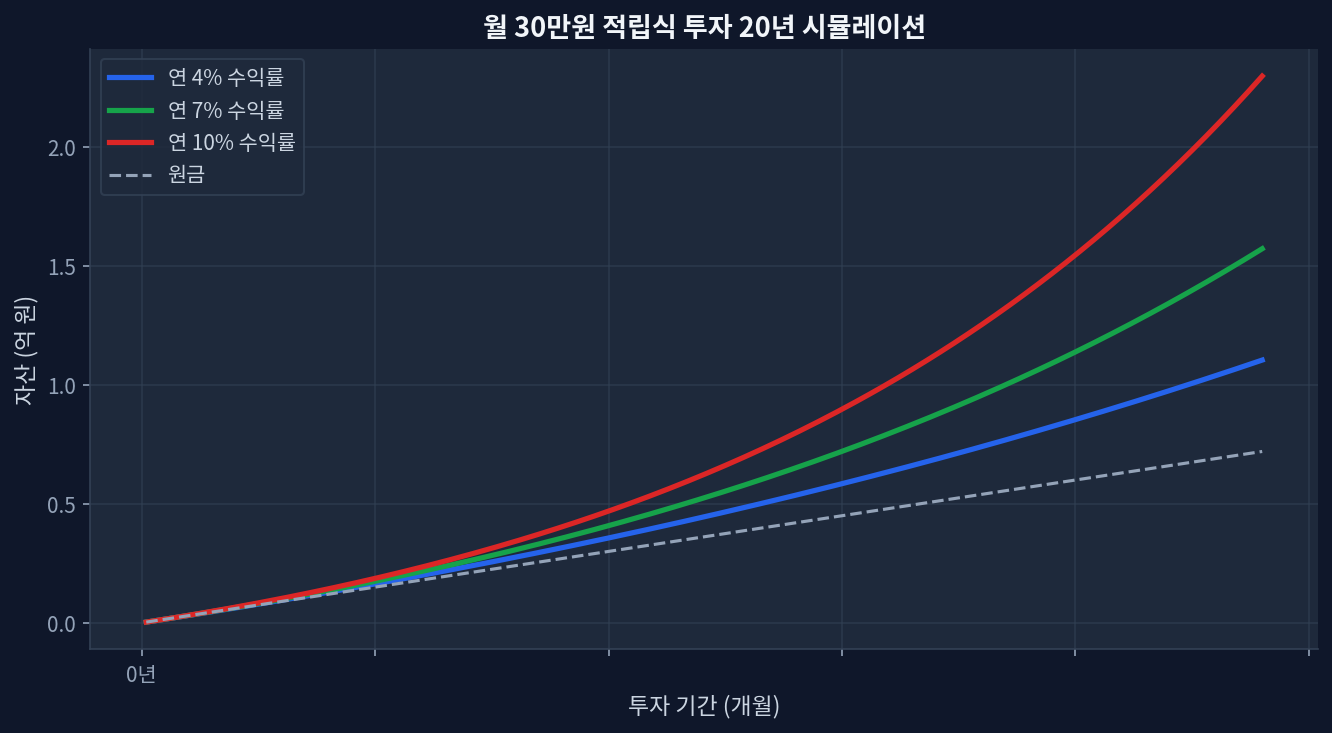
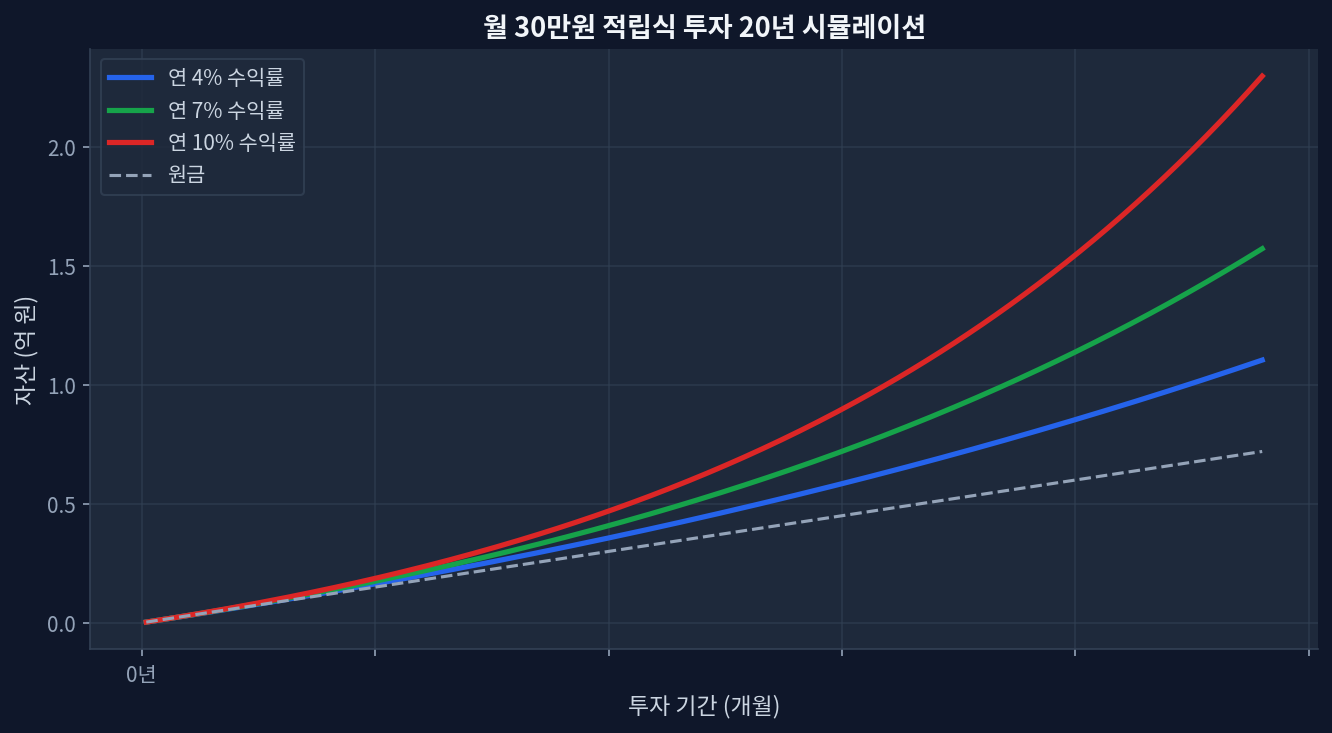
5-year return: QQQ gained +120.7%, QQQM +121.6% — both tracking Nasdaq-100 within basis pointsM7 concentration: ~40% portfolio weight in mega-cap tech; amplifies gains in bull markets but volatility-decomposition-when-3x-trails-2x/">drawdown risk spikes during rotationDividend yield: QQQ 0.39%, QQQM 0.43% — meaningful for reinvestment over 5+ yearsEntry timing matters: Starting in March 2020 (bottom) vs November 2021 (peak) produces 40%+ return variance by 2026Scale advantage: QQQ ($494B AUM) vs QQQM ($96.9B) — liquidity differs; TIGER sits between them The 5-Year Test: What Actually Happened Monthly $30K investment 20-year compound growth simulation From March 2020 to June 2026, both QQQ and QQQM delivered a +120% total return[Yahoo Finance]. On paper, this makes tech-heavy ETFs look like a no-brainer. But the path mattered enormously. The Nasdaq-100 surged 180% between the March 2020 lows and November 2021 peak, then reversed sharply through 2022. Investors who held through both legs netted gains; those who panicked in the 2022 drawdown sold near lows and never participated in the 2023–2026 recovery. ...

June 13, 2026 · InvestIQs Research

June 13, 2026 US Market Close: S&P 500 $741.75 +0.54%, Nasdaq +0.59%

⚠️ Daily market snapshot — informational only This article summarizes publicly available yfinance data. It is not investment advice and does not recommend buying or selling any security. All investment decisions and outcomes are your own responsibility. 🧭 Market Sentiment: Greed 😊 (56/100) ██████░░░░ Estimated from VIX 17.68 📊 Market Breadth · 🟢 sectors 9/11 advancing (82%) · 🟡 Mag7 4/7 advancing (57%) Summary: S&P 500 $741.75 +0.54%, Nasdaq +0.59%, VIX 17.68. Leaders: XLB, XLF, XLU / Laggards: XLC, XLV, XLY. ...

June 13, 2026 · InvestIQs Editorial