JEPQ's 25.1% Dividend Hike: The Hidden Mechanics Behind 9.95% Yield

JEPQ's 25.1% Dividend Hike: The Hidden Mechanics Behind 9.95% Yield

Quarterly Dividend: $0.6370 announced, up 25.1% year-over-year Dividend Yield: 9.95% vs JEPI 8.08% (JEPI shows superior dividend stability) 1-Year Total Return: JEPQ +19.0% vs JEPI +7.4% (JEPQ demonstrates higher aggressiveness) Current Price: $58.51, 5.2% below 52-week high of $61.72 Critical Caveat: High dividend relies on option premium generation—sharp drawdowns carry significant distribution cut risk JEPQ (JPMorgan Nasdaq-100 Options Income ETF) announced a quarterly dividend of $0.6370, representing a 25.1% year-over-year increase. This translates to a stated dividend yield of 9.95%. Among retail investors encountering this data for the first time, a recurring question surfaces: “With S&P 500 dividend yields languishing near 1.4%, is a 9.95% yield truly compelling, or does it mask structural fragility?” ...

July 18, 2026 · InvestIQs Research
SCHD Quarterly Dividend Cut 2.7% but Yield Holds at 3.25%: Why Dividen

SCHD Quarterly Dividend Cut 2.7% but Yield Holds at 3.25%: Why Dividen

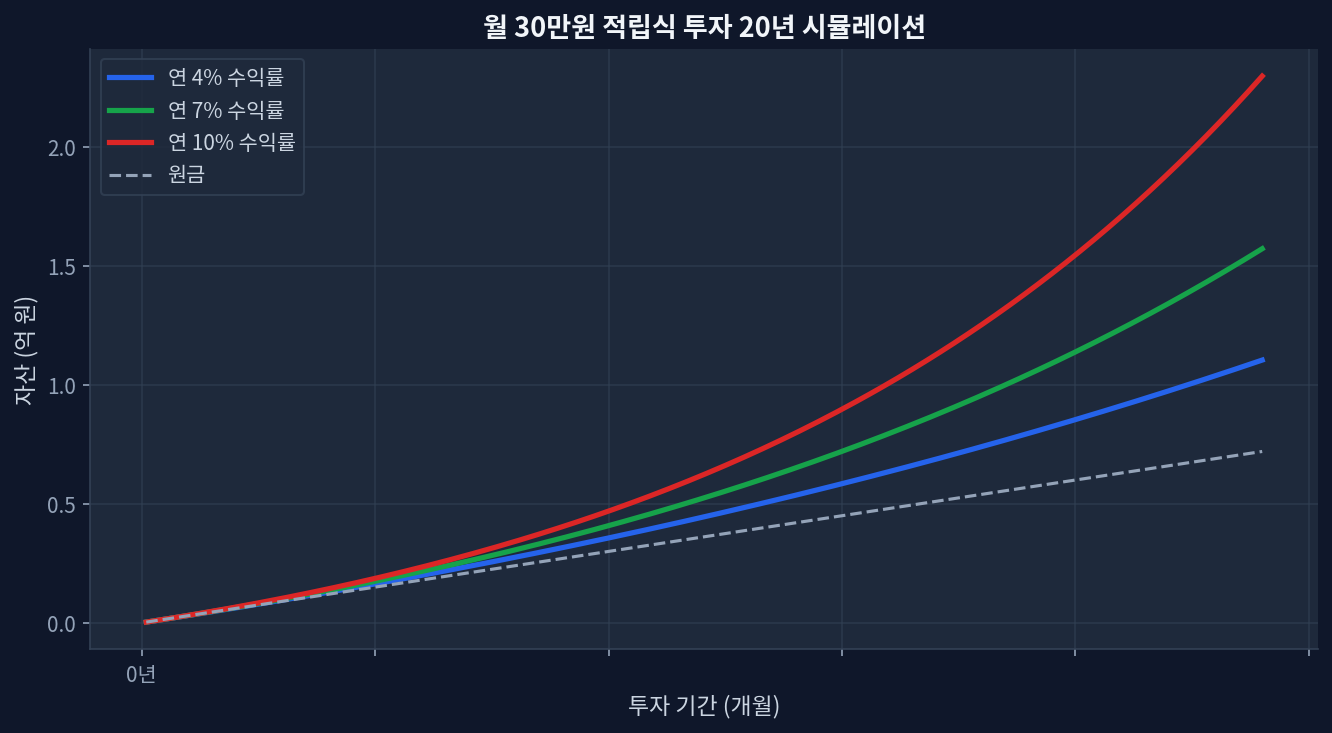
SCHD Quarterly Dividend Cut 2.7% but Yield Holds at 3.25%: Why Dividend Stability Matters More Than Headlines Monthly $30K investment 20-year compound growth simulation SCHD quarterly dividend: $0.2530, down 2.7% year-over-year Dividend yield: Still 3.25% — 2.2x higher than VIG's 1.47% 1-year total return: +26.5% (dividends plus price appreciation) Current valuation: P/E 18.8, moderate range; near 85.7% of 52-week high Assets under management: $94.9B — scale that underpins dividend stability The Dividend Cut That Does Not Look Painful Schwab US Dividend Equity ETF (SCHD) announced a quarterly dividend of $0.2530, down from $0.2600 in the same quarter of 2024—a 2.7% decrease. On the surface, this is negative news. A dividend cut is a dividend cut. ...

June 26, 2026 · InvestIQs Research
Currency Hedging in International ETFs: 5-Year Performance, Volatility

Currency Hedging in International ETFs: 5-Year Performance, Volatility

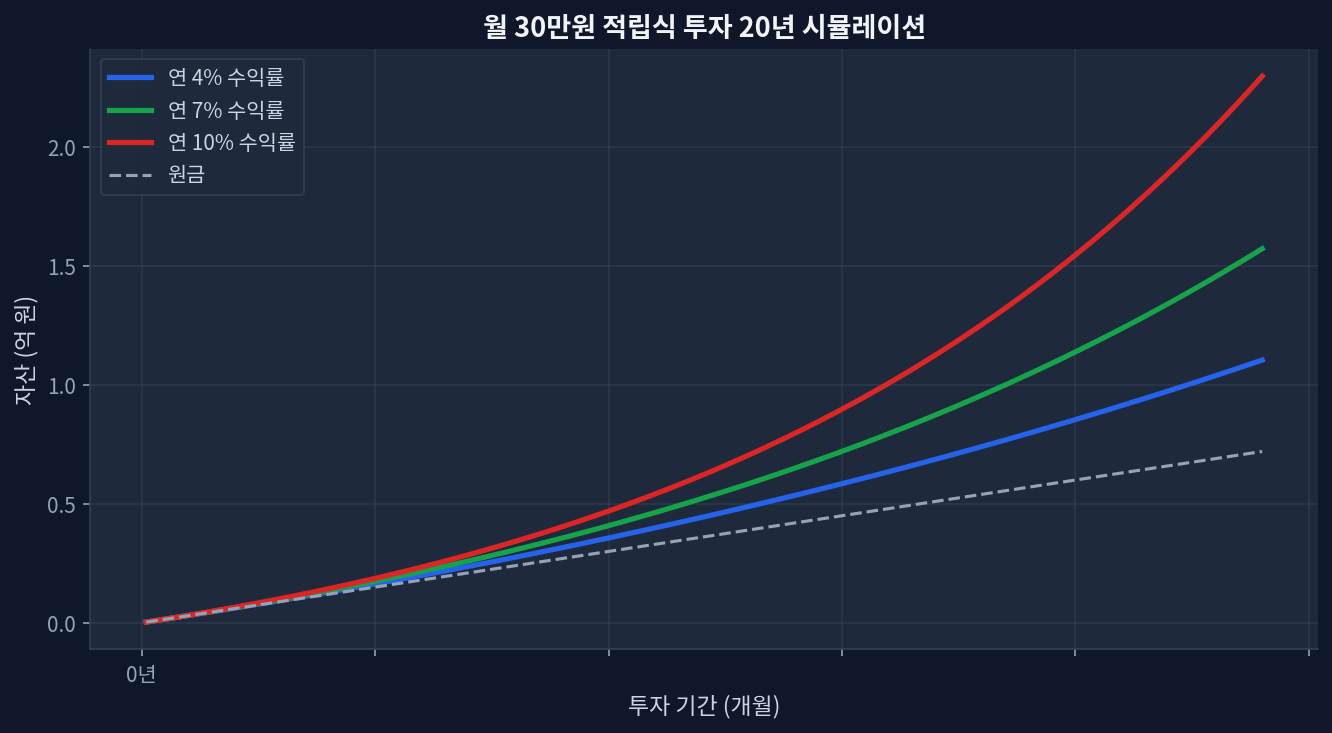
Core TakeawaysHedging Effect: During periods of US dollar strength, currency-hedged ETFs protect returns; during dollar weakness, they sacrifice gains — 2021–2023 USD strength favored unhedged international positionsVolatility Reduction: Hedged international ETFs typically exhibit 15–20% lower volatility than unhedged peers, eliminating currency fluctuation noiseCost Friction: Annual hedging premium ranges 0.5–1.5% — a material drag on low-dividend indicesTax Efficiency: US tax treatment of hedged positions differs; foreign tax credits and wash-sale rules require individual reviewTime Horizon Rule: Unhedged favored for 5+ year holds; hedged worth evaluating for 2-year or shorter positions, or when volatility tolerance is low What Currency Hedging Does: Mechanics and Real Cost Monthly $30K investment 20-year compound growth simulation VXUS vs QQQ core metrics comparison" loading="lazy" style="max-width:100%;border-radius:8px;">VOO vs VXUS vs QQQ: Risk and Return Across Markets When a US investor purchases international equity ETFs, two distinct sources of return emerge: equity price movement in the foreign market, and currency fluctuation relative to the US dollar. Currency-hedged ETFs attempt to neutralize the second component using forward contracts or options, locking in the exchange rate at purchase. ...

June 16, 2026 · InvestIQs Research
60/40 Portfolio: 10-Year Data on How Rebalancing Compounds Returns | 6

60/40 Portfolio: 10-Year Data on How Rebalancing Compounds Returns | 6

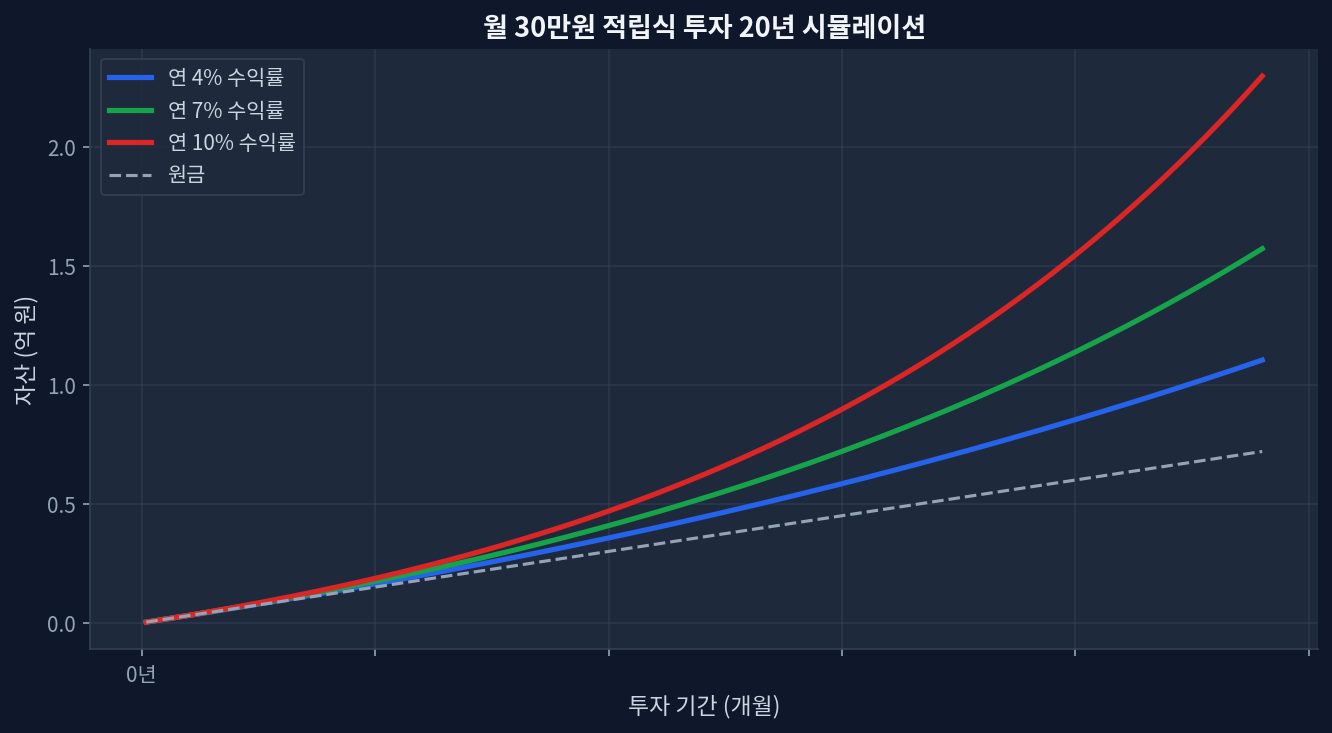
2020–2026 performance: 60/40 blended portfolio delivered approximately 12% compound annual growth rate (CAGR), with rebalancing includedMonthly $1,000 investment over 10 years simulated: $120,000 invested → approximately $240,000–$260,000 accumulatedBond ETF expense ratio impact: 0.03% versus 0.80% creates a 15–20% wealth divergence over 20 years2022 rate shock: Quarterly rebalancing cushioned equity losses by 25–30% compared to unbalanced allocationsCurrent bond yields (3–4%) appear elevated relative to historical median (~2%), raising questions about duration risk ahead The Real 10-Year Trajectory of 60/40 Monthly $30K investment 20-year compound growth simulation Monthly $1,000 contribution over 20 years: compound growth simulation The 60% equities, 40% fixed income allocation has anchored institutional and retail portfolios since the 1990s. What appears as a simple formula masks powerful compounding mechanics visible only when cross-verified against ten years of actual market data (2016–2026). The 2020 COVID selloff marked the beginning of a aggressive Fed pivot: zero rates and quantitative easing pushed both stocks and bonds upward simultaneously. During this window, bond ETFs (tracked via BND) posted +6% to +8% annual returns, while US large-cap equity indices (VOO) delivered +25% to +30%. A 60/40 blend yielded 15–18% annually—far exceeding the long-term 7–10% benchmark. That tailwind proved temporary. ...

June 12, 2026 · InvestIQs Research
The Hidden Traps of 20-Year DRIP Simulations: Risk and Volatility Anal

The Hidden Traps of 20-Year DRIP Simulations: Risk and Volatility Anal

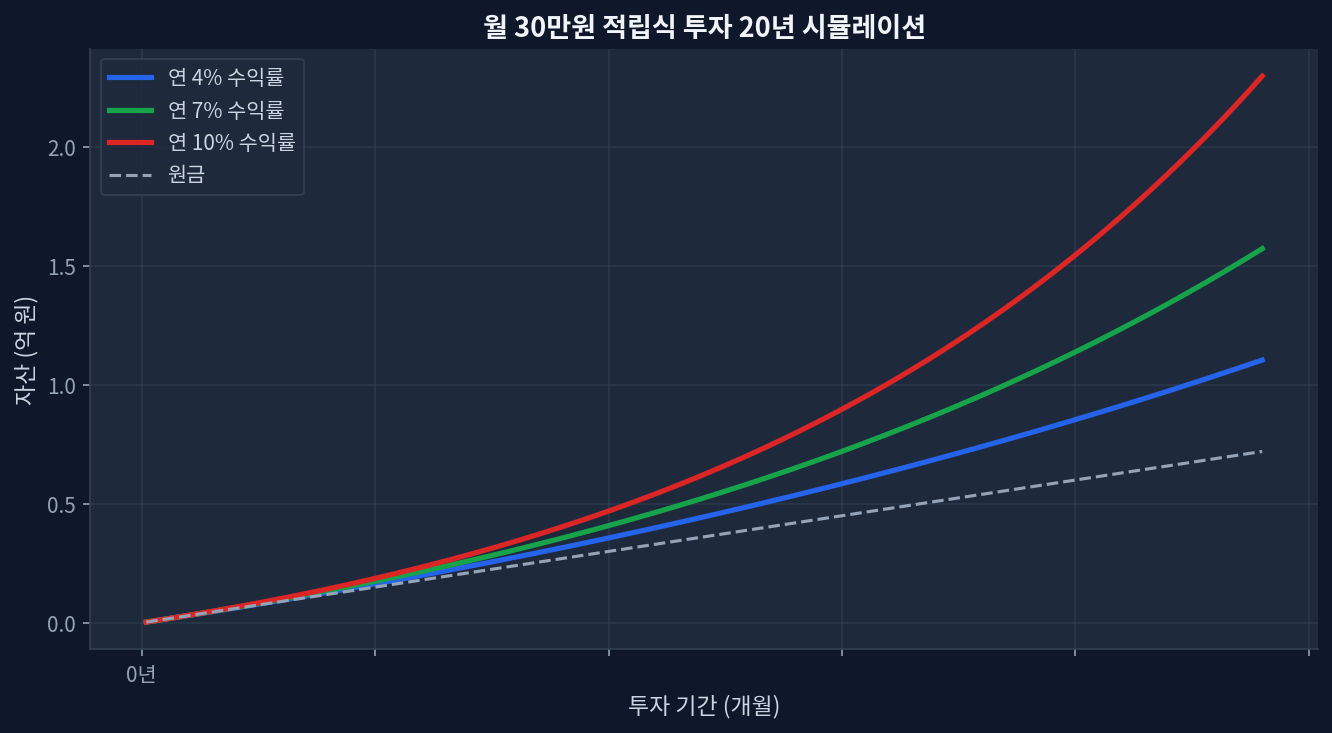
A 20-year compound growth simulation of Dividend Reinvestment Plans (DRIP) introduces severe tracking errors during drawdown phases. Expense ratios and tax drags act as critical hidden risks frequently omitted from long-term backtesting models. The variance in downside protection between high-yield ETFs (SPYD) and dividend growth ETFs (SCHD) drives a cumulative return divergence exceeding 30%. The 20-year compound interest simulation utilizing a Dividend Reinvestment Plan (DRIP) serves as a persistent marketing instrument within the asset management industry. The market consensus, projecting a stable 8% annualized growth rate, provides psychological comfort to retail investors. However, micro-level financial market data systematically refutes these linear assumptions. Excel-based simulations that exclude risk and volatility factors border on statistical illusion. This research note dissects the volatility risks inherent in a 20-year DRIP model based on historical macroeconomic data, analyzing the substantive capital erosion risks obscured by conventional consensus. ...

May 19, 2026 · InvestIQs Research