SCHD Dividend Cut of -2.7% Yet Yield Holds at 3.25%: Dividend Stabilit
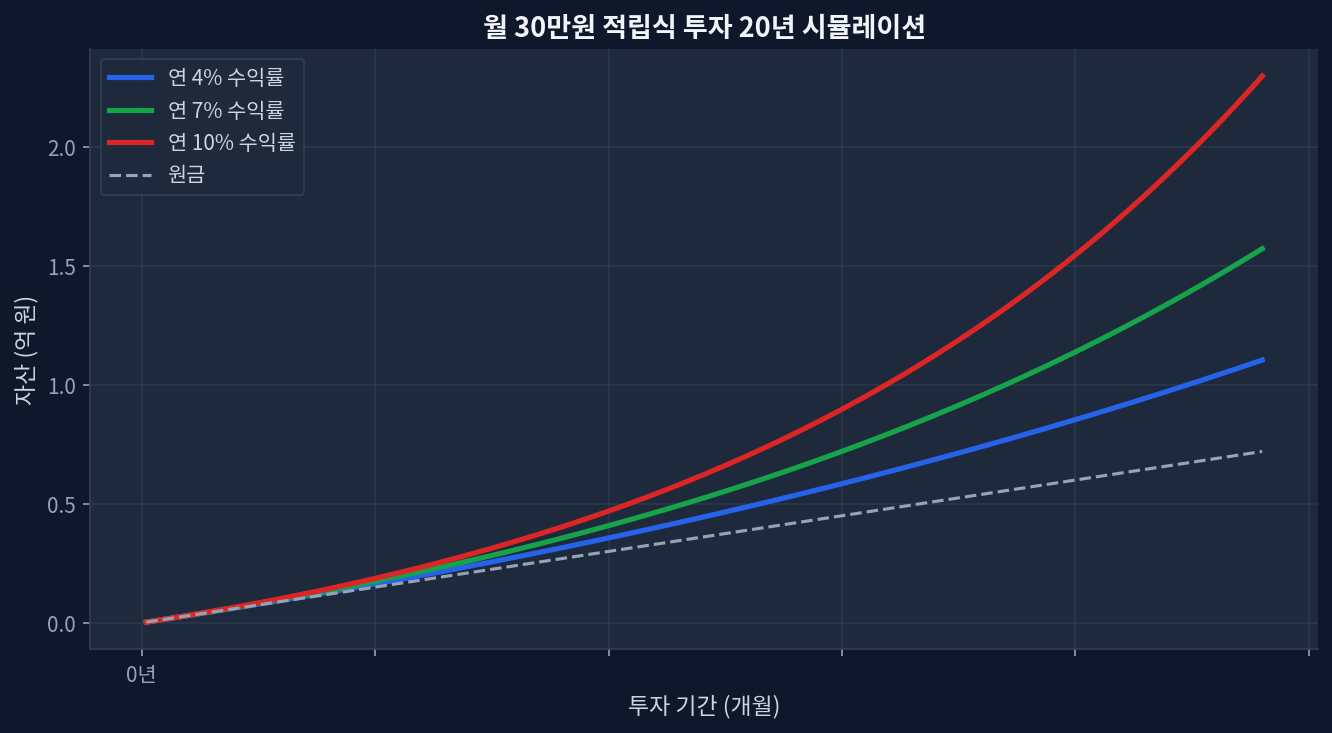
SCHD Dividend Cut of -2.7% Yet Yield Holds at 3.25%: Dividend Stability Through Market Cycles Monthly $30K investment 20-year compound growth simulation SCHD quarterly dividend: $0.2530, down 2.7% year-over-year Dividend yield: Still 3.25% — 2.2x higher than VIG's 1.47% 1-year total return: +26.5% (dividends plus capital appreciation) Current valuation: P/E 18.8, moderate level; trading near 85.7% of 52-week high Assets under management: $94.9B — scale supporting dividend stability The Dividend Cut That Does Not Signal Weakness 20-year monthly investment accumulation with dividend reinvestment Schwab US Dividend Equity ETF (SCHD) announced its quarterly dividend at $0.2530, representing a 2.7% decrease versus the same quarter in 2024 when it paid $0.2600. On its surface, this reads negative—dividends were reduced, after all. ...