JEPQ's 25.1% Dividend Hike: The Hidden Mechanics Behind 9.95% Yield

JEPQ's 25.1% Dividend Hike: The Hidden Mechanics Behind 9.95% Yield

Quarterly Dividend: $0.6370 announced, up 25.1% year-over-year Dividend Yield: 9.95% vs JEPI 8.08% (JEPI shows superior dividend stability) 1-Year Total Return: JEPQ +19.0% vs JEPI +7.4% (JEPQ demonstrates higher aggressiveness) Current Price: $58.51, 5.2% below 52-week high of $61.72 Critical Caveat: High dividend relies on option premium generation—sharp drawdowns carry significant distribution cut risk JEPQ (JPMorgan Nasdaq-100 Options Income ETF) announced a quarterly dividend of $0.6370, representing a 25.1% year-over-year increase. This translates to a stated dividend yield of 9.95%. Among retail investors encountering this data for the first time, a recurring question surfaces: “With S&P 500 dividend yields languishing near 1.4%, is a 9.95% yield truly compelling, or does it mask structural fragility?” ...
July 18, 2026 · InvestIQs Research
JEPQ Quarterly Dividend Increase Analysis: Evaluating Returns and Volatility Risk for High-Yield ETFs

JEPQ Quarterly Dividend Increase Analysis: Evaluating Returns and Volatility Risk for High-Yield ETFs

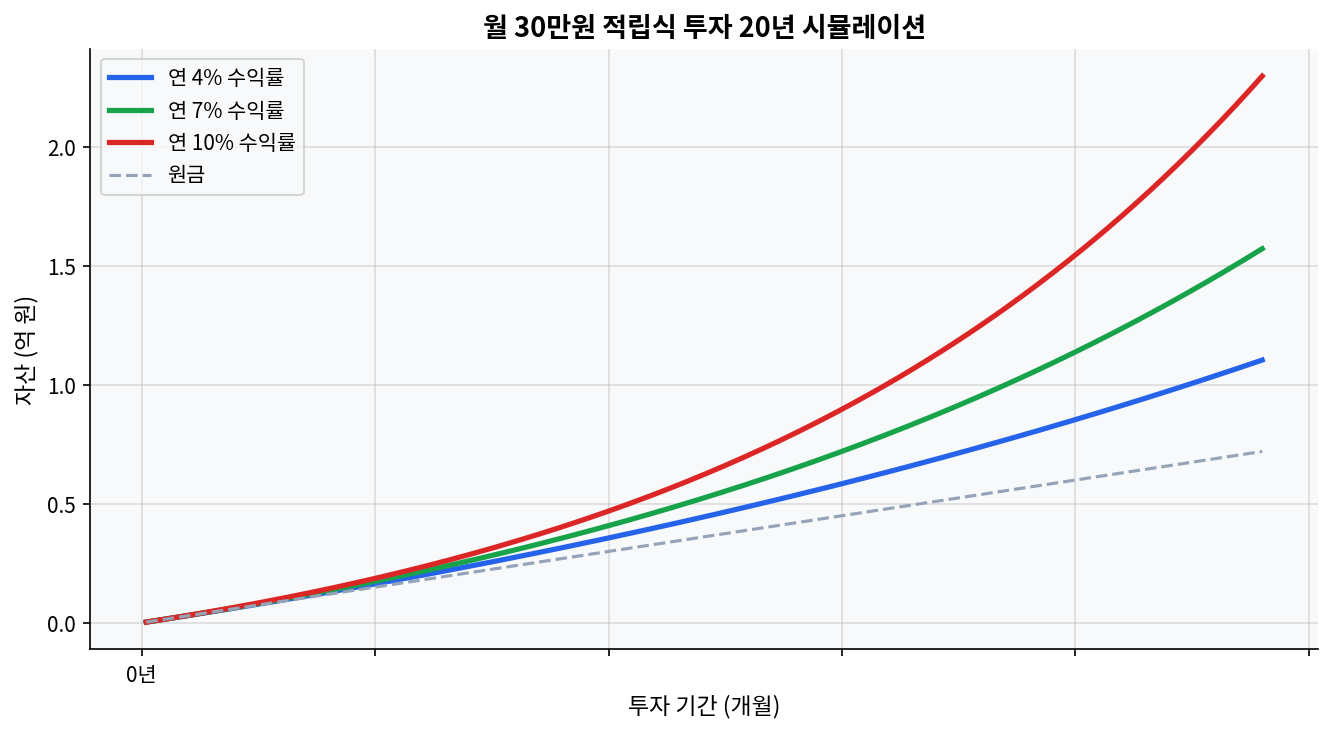
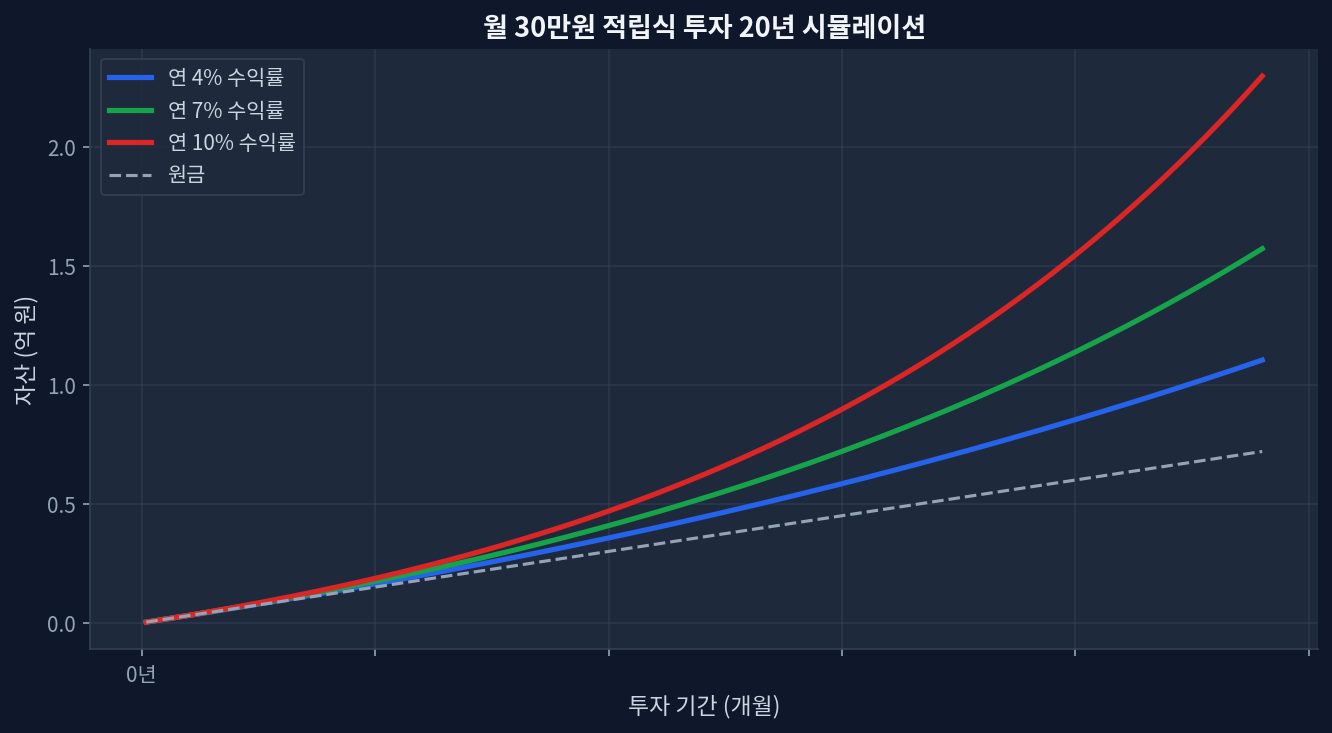
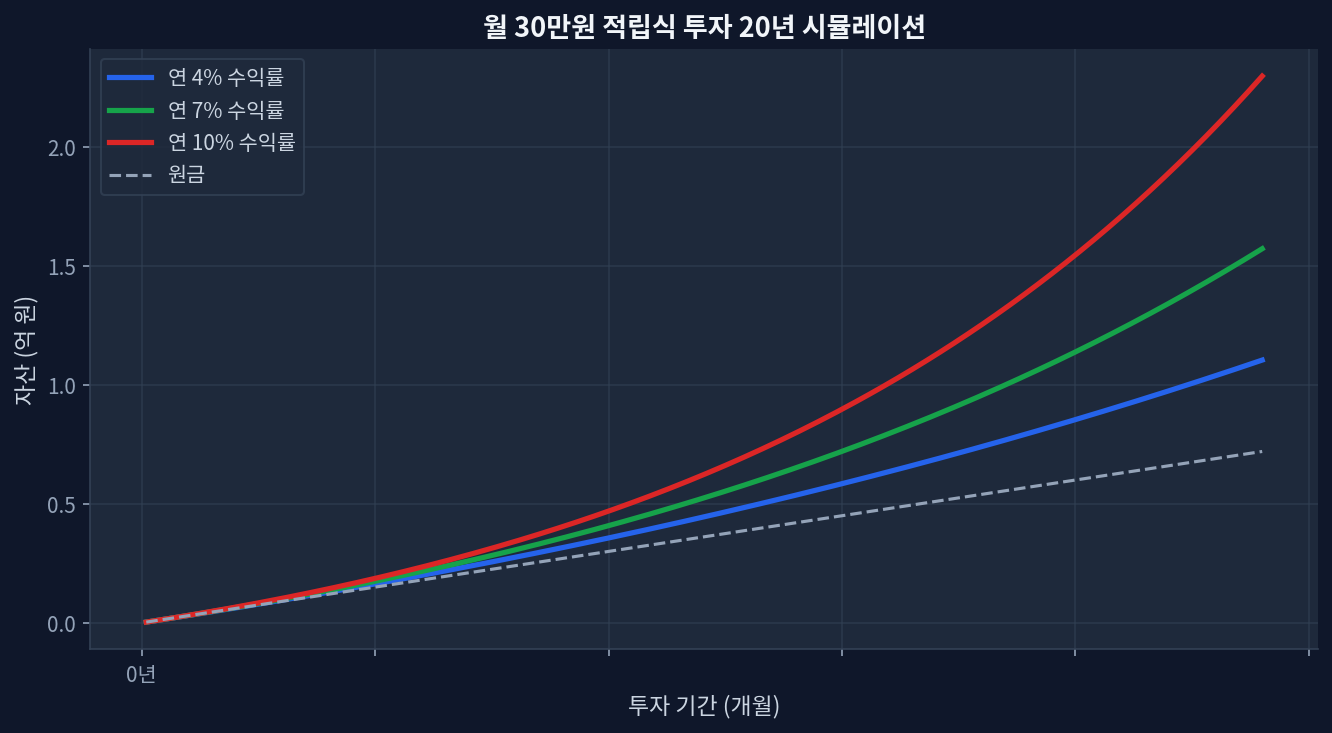
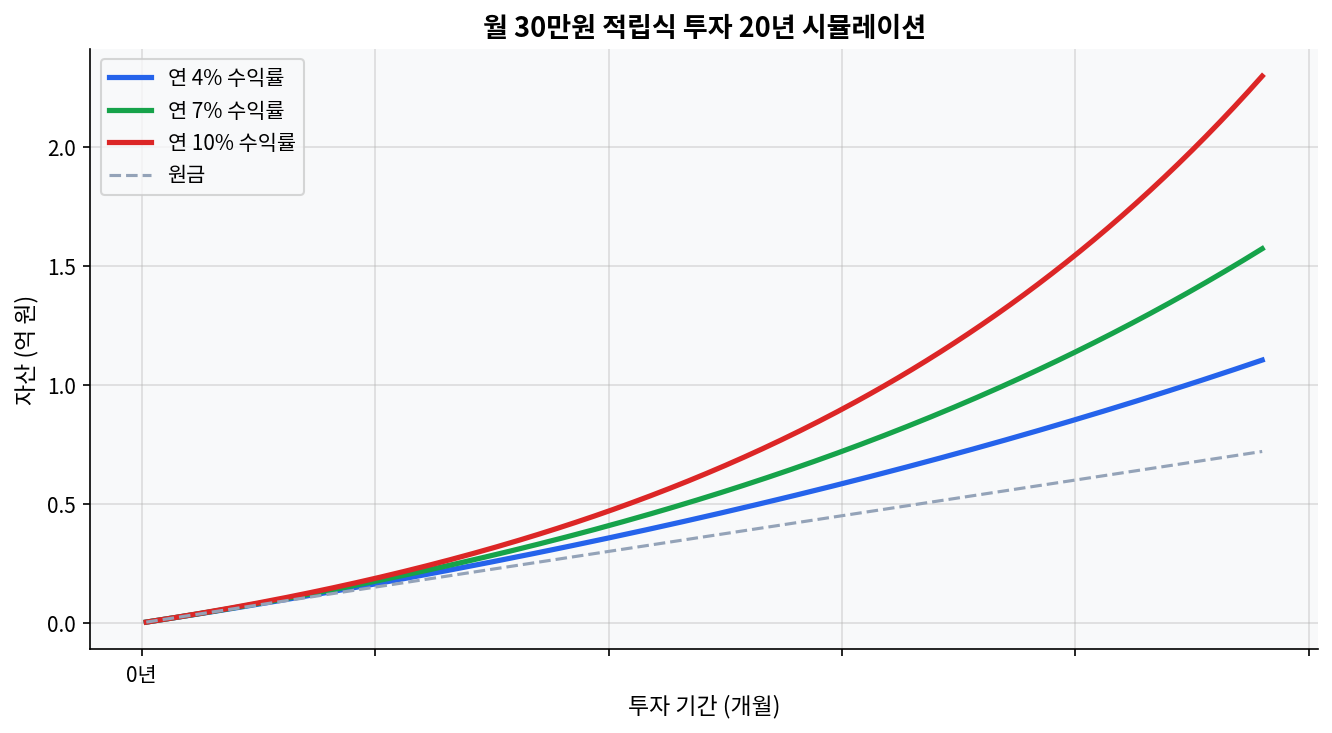
JEPQ's recent quarterly dividend was $0.5910 per share, marking a 2.6% increase year-over-year. JEPQ has shown strong short- to medium-term performance with a 1-year return of +27.4% and a 3-year cumulative return of +79.1%, closely tied to the volatility of its underlying asset, the Nasdaq 100 index. Its current dividend yield is 10.35%, but this largely depends on option premium income due to the nature of the covered call strategy, implying inherent dividend variability based on market conditions. Comparative analysis with JEPI shows JEPQ recording higher returns and dividend yields, attributable to differing exposure to technology-driven growth momentum. The attractive yields of high-dividend covered call ETFs come with risks, including vulnerability to price declines during market downturns and the potential for unexpected dividend cuts. JEPQ Quarterly Dividend Announcement Analysis: Returns and Volatility Perspective Monthly $30K investment 20-year compound growth simulation 20-Year Compound Growth Simulation of Monthly Dollar-Cost Averaging JEPQ recently announced a quarterly dividend of $0.5910 per share, drawing investor attention. This 2.6% year-over-year increase underscores the appeal of covered call ETFs that pursue both growth and income. Currently, JEPQ’s share price stands at $59.66, with a dividend yield of 10.35%, an attractive figure for those seeking high-yield investments. However, a deeper analysis is warranted regarding the stock price volatility accompanying such high dividend yields and the sustainability of these returns. ...

May 13, 2026
TQQQ’s 5-Year Drawdown and Volatility Breakdown: Where 3x Lagged 2x

TQQQ’s 5-Year Drawdown and Volatility Breakdown: Where 3x Lagged 2x

As of 2026-04-21, TQQQ’s five-year total return was 120.40%, with a CAGR of 16.57%.As of 2026-03-31, TQQQ’s five-year maximum drawdown was 81.65%, versus 35.12% for QQQ, or 2.33x deeper.Five-year annualized monthly volatility came in at 61.28% for TQQQ, 20.23% for QQQ, and 40.61% for QLD.Over the same five-year window, QLD outpaced TQQQ with a 137.48% total return and an 18.77% CAGR.Dividend yield was roughly 0.53% for TQQQ, 0.15% for QLD, and 0.43% for QQQ, which is why the real story in leveraged ETFs is path dependence, not cash flow. The Two Charts Say It First Monthly investment 20-year compound growth simulation Comparison of how ETF fee differences affect long-term wealth The first chart shows the 20-year wealth gap between a 0.05% ETF fee and a 1.0% fee. The second shows how monthly investing of $300 compounds very differently at 4%, 7%, and 10% over time. In a TQQQ discussion, those charts are not background material. For leveraged ETFs, costs and path shape the capital curve faster than the return table suggests. Even when TQQQ rallies hard between 2020 and 2026, the first question is how much damage a single 2022-style crash can do to the long-term line. ...

April 25, 2026
TQQQ Five-Year Drawdown and Volatility Decomposition: When 3x Trails 2x

TQQQ Five-Year Drawdown and Volatility Decomposition: When 3x Trails 2x

As of 2026-04-21, TQQQ’s 5-year total return was 120.40%, with a CAGR of 16.57%.As of 2026-03-31, TQQQ’s 5-year maximum drawdown was 81.65%, compared with 35.12% for QQQ.5-year annualized monthly volatility was 61.28% for TQQQ, 20.23% for QQQ, and 40.61% for QLD.Over the same 5-year window, QLD outperformed TQQQ with a total return of 137.48% and a CAGR of 18.77%.Dividend yield sat at 0.53% for TQQQ, 0.15% for QLD, and 0.43% for QQQ. For leveraged ETFs, the core driver is not cash flow but path dependency. The Two Charts Say the First Thing Comparison of how ETF fee differences affect long-term returns The first chart shows the long-run asset gap between 0.05% and 1.0% ETF fees over 20 years. The second shows how monthly $300 contributions diverge over time at 4%, 7%, and 10% annual returns. In the TQQQ discussion, those two charts are not background noise. For leveraged ETFs, cost and path shape the equity curve faster than the headline return table suggests. Even if TQQQ posts a strong 2020-2026 run, a single 2022-style collapse can damage the long-run profile in ways that are hard to reverse. ...

April 24, 2026