VOO DCA After 12 Months: Real Returns, Mistakes, and SCHD Contrast
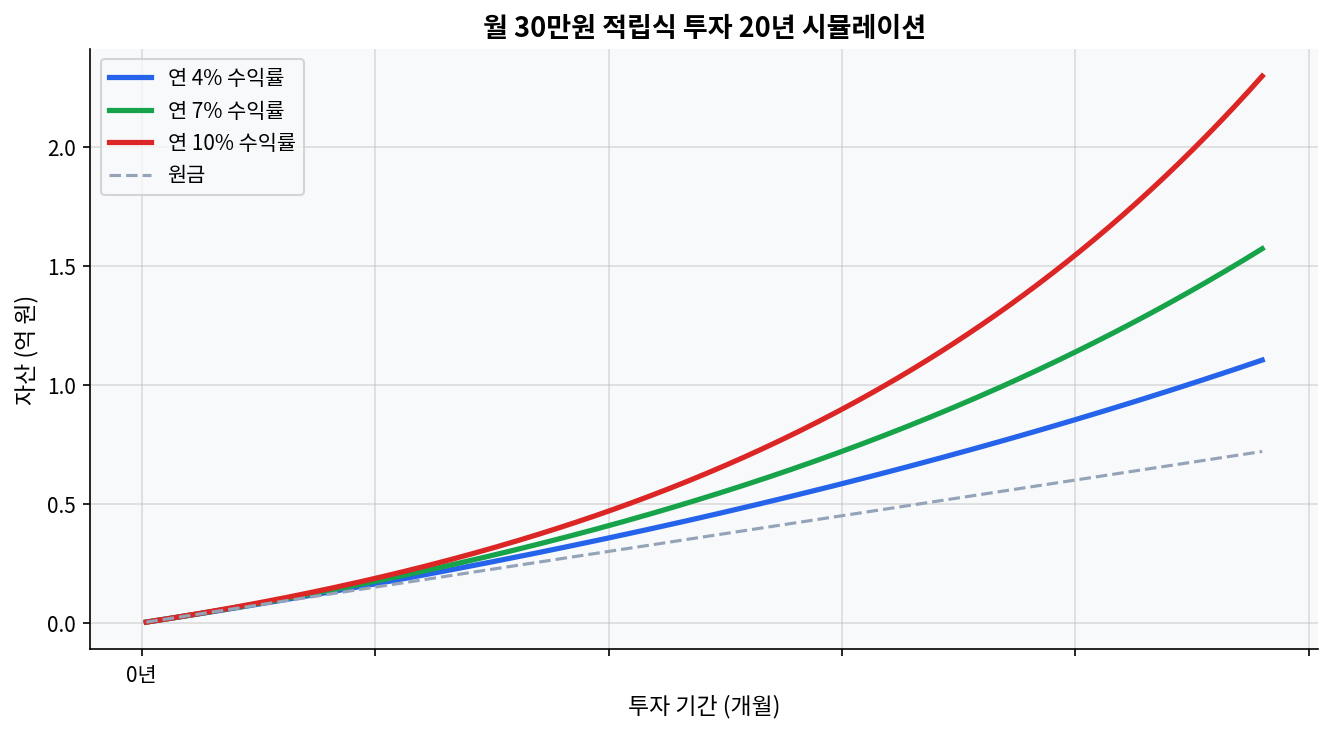
VOO sits at $651.54 with a 1-year return of +36.3%, a 3-year cumulative return of +79.0%, a 5-year cumulative return of +85.0%, and a dividend yield of 1.09%.SCHD sits at $31.03 with a 1-year return of +26.8%, a 3-year cumulative return of +41.5%, a 5-year cumulative return of +49.8%, and a dividend yield of 3.4%.Across the provided windows, VOO beat SCHD by 9.5 percentage points over 1 year, 37.5 points over 3 years, and 35.2 points over 5 years on cumulative return.The chart below tests monthly KRW 300,000 DCA over 20 years at 4%, 7%, and 10%; the gap between those paths shows how sensitive long-horizon outcomes are to small return differences.The biggest mistake in a first-year DCA window is treating a strong 12-month run as a permanent feature of the market instead of a regime that can change fast. What the 20-year DCA chart is really saying Monthly investment 20-year compound growth simulation The chart beneath this section is the cleanest reminder that monthly ETF investing is about time, not drama. A monthly KRW 300,000 plan over 20 years looks modest in year 1, then starts to separate sharply when the assumed return moves from 4% to 7%, and again from 7% to 10%. That is the core lesson. The later contributions matter less than the early contributions once compounding starts doing real work. ...