TIGER S&P500 ETF vs US Alternatives: Tax & Diversification Dynamics

TIGER S&P500 ETF vs US Alternatives: Tax & Diversification Dynamics

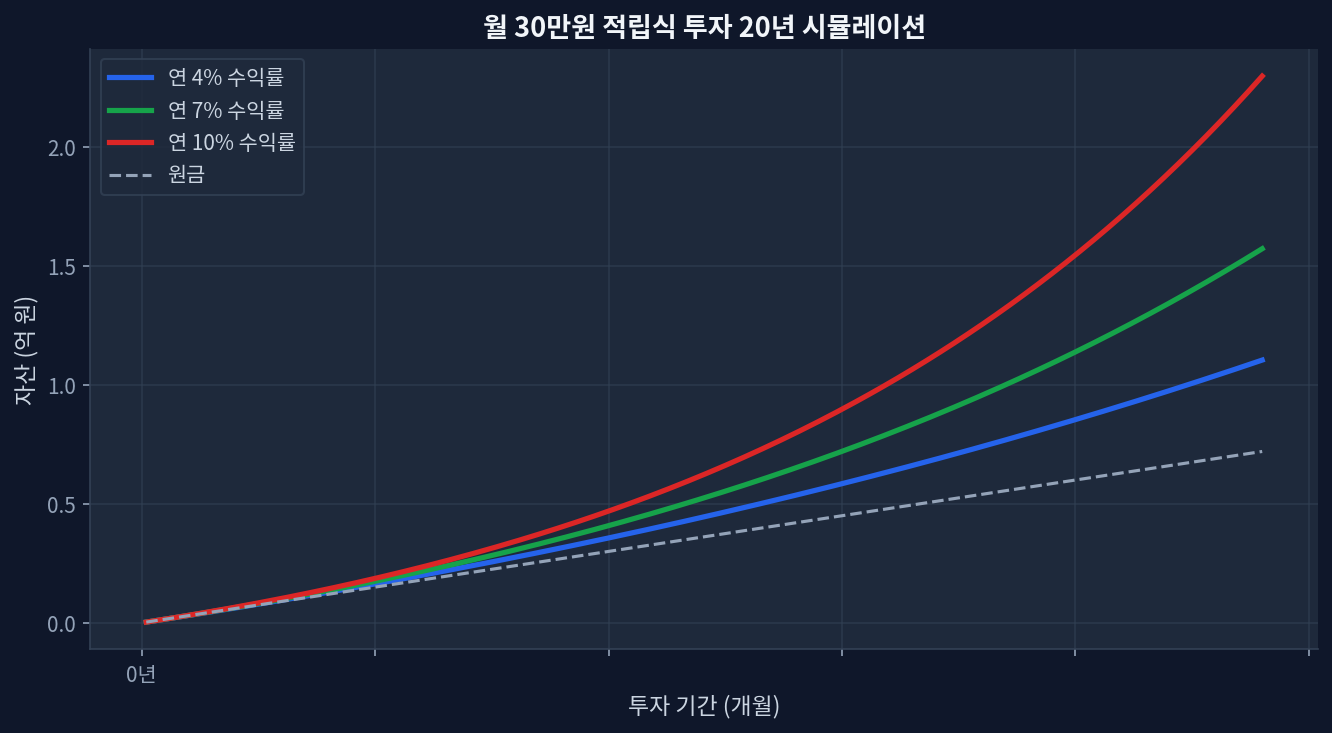
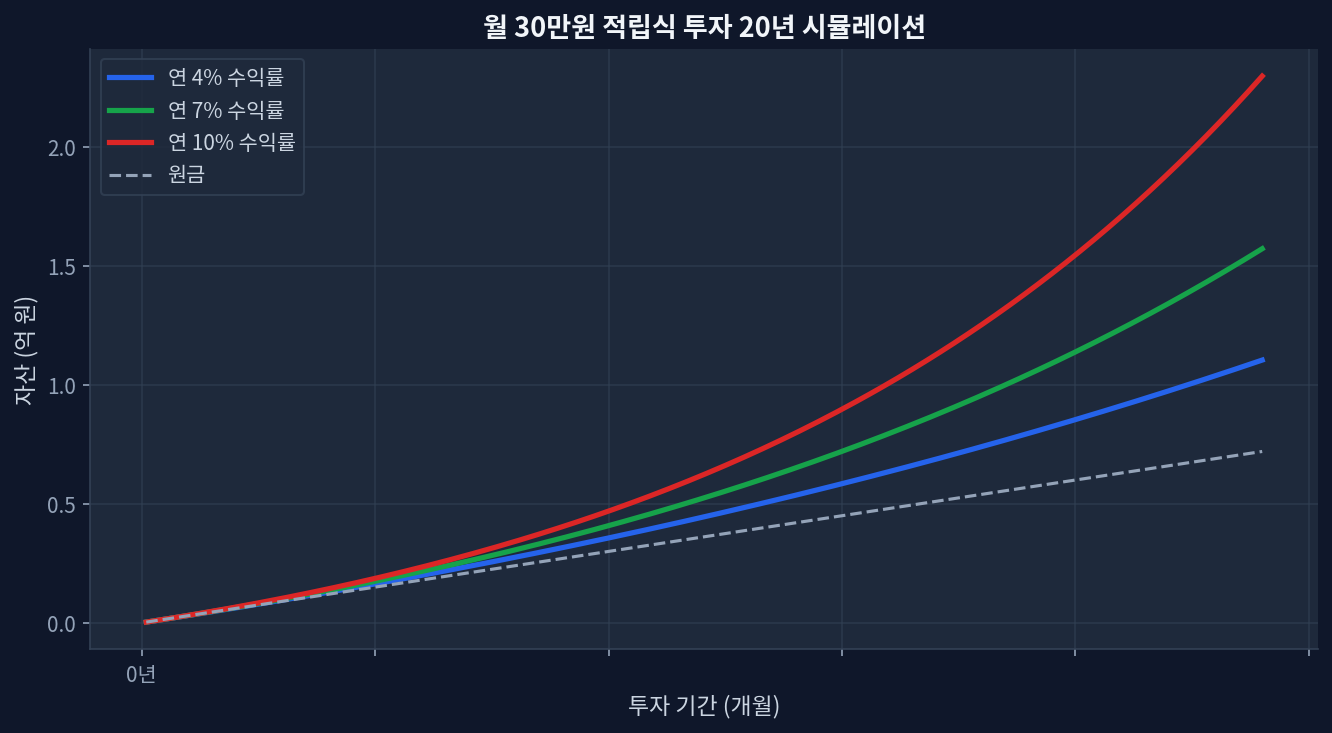
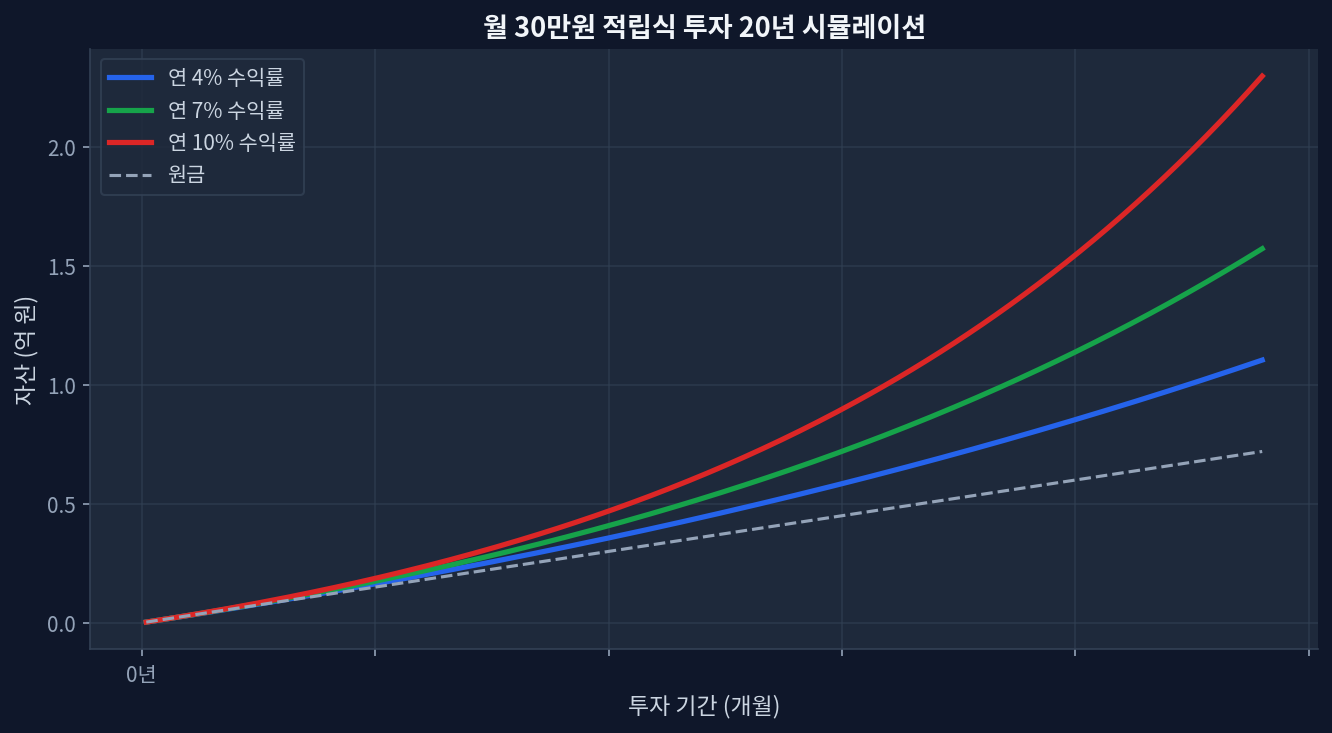
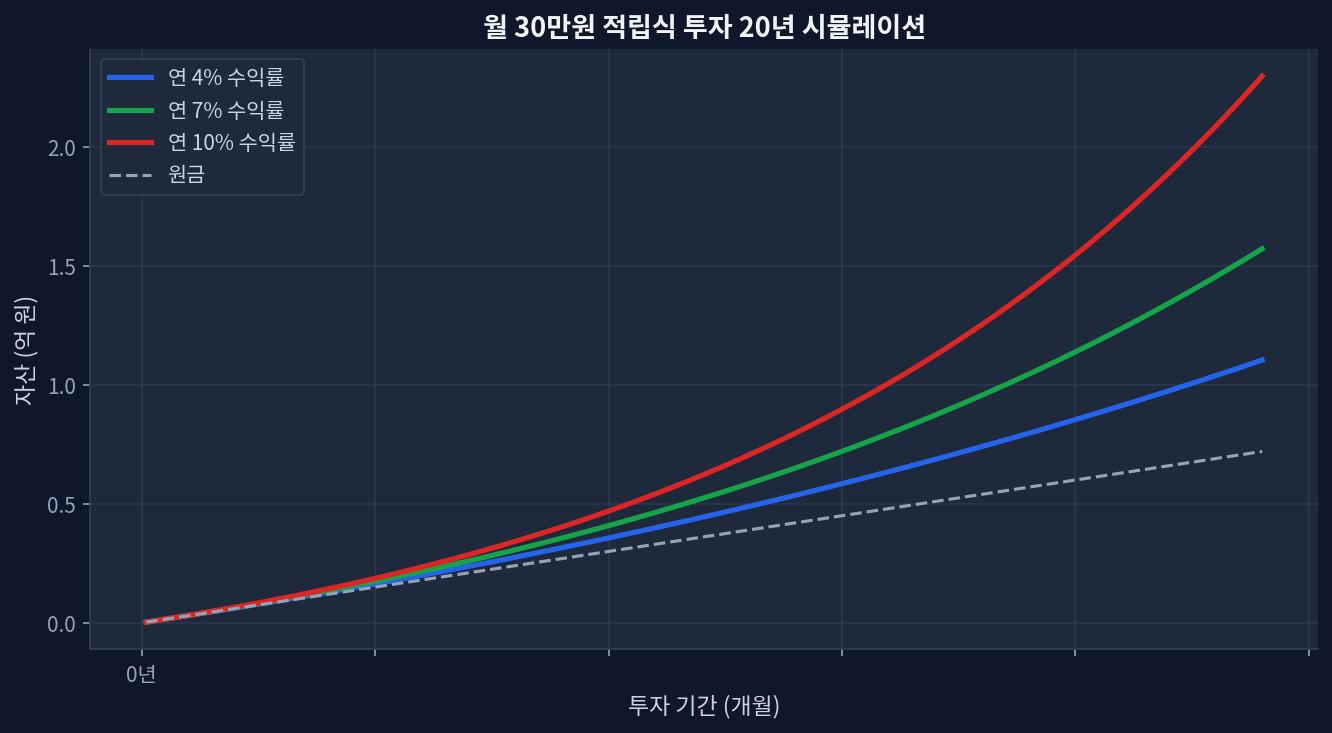
TIGER tracked +86.0% over 5 years (2020–2026), matching US-listed VOO's performance but with Korean tax and currency considerationsschd-which-etf-wins-under-a-15-capital-gains-tax-regime/">VOO yields 1.03% at 26.2× P/E; SCHD yields 3.25% at 18.9× P/E—representing core-growth versus income-focused positioningKorea's 22% capital gains tax versus US 15–20% rates creates different tax-optimization strategies, not fund-specific savingsGeographic diversification through TIGER makes sense for global investors managing multiple accounts; US-based investors typically prefer VOO's liquidityTax efficiency depends more on account structure (tax-deferred vs. taxable) and holding discipline than ETF choice itselfWhy Global Investors Consider TIGER (And Why It Rarely Makes Sense for US Residents) Monthly $30K investment 20-year compound growth simulation TIGER 미국S&P500 is a Korean-domiciled ETF tracking the S&P500, available primarily through Korean brokers and some international platforms like Interactive Brokers. For investors outside the US or managing Korean-based capital, TIGER provides familiar tax reporting and avoids certain cross-border withholding complexities. For US tax residents, the picture inverts: direct ownership of VOO ($670.26, $1.7 trillion AUM) offers superior liquidity, lower fees (0.03%), and simpler tax treatment under IRC statutes. ...
June 28, 2026 · InvestIQs Research
Samsung Dividend Reinvestment: Path to 8% Annual Returns Over 5 Years

Samsung Dividend Reinvestment: Path to 8% Annual Returns Over 5 Years

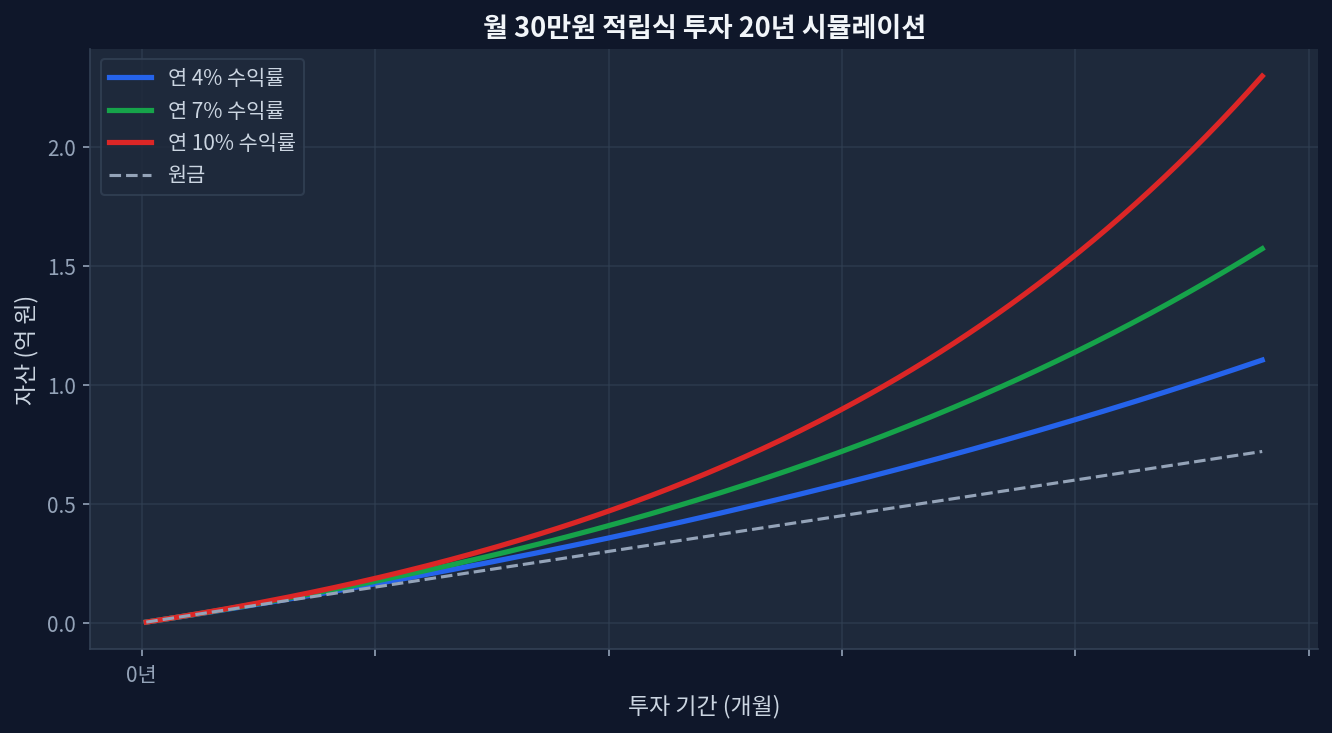
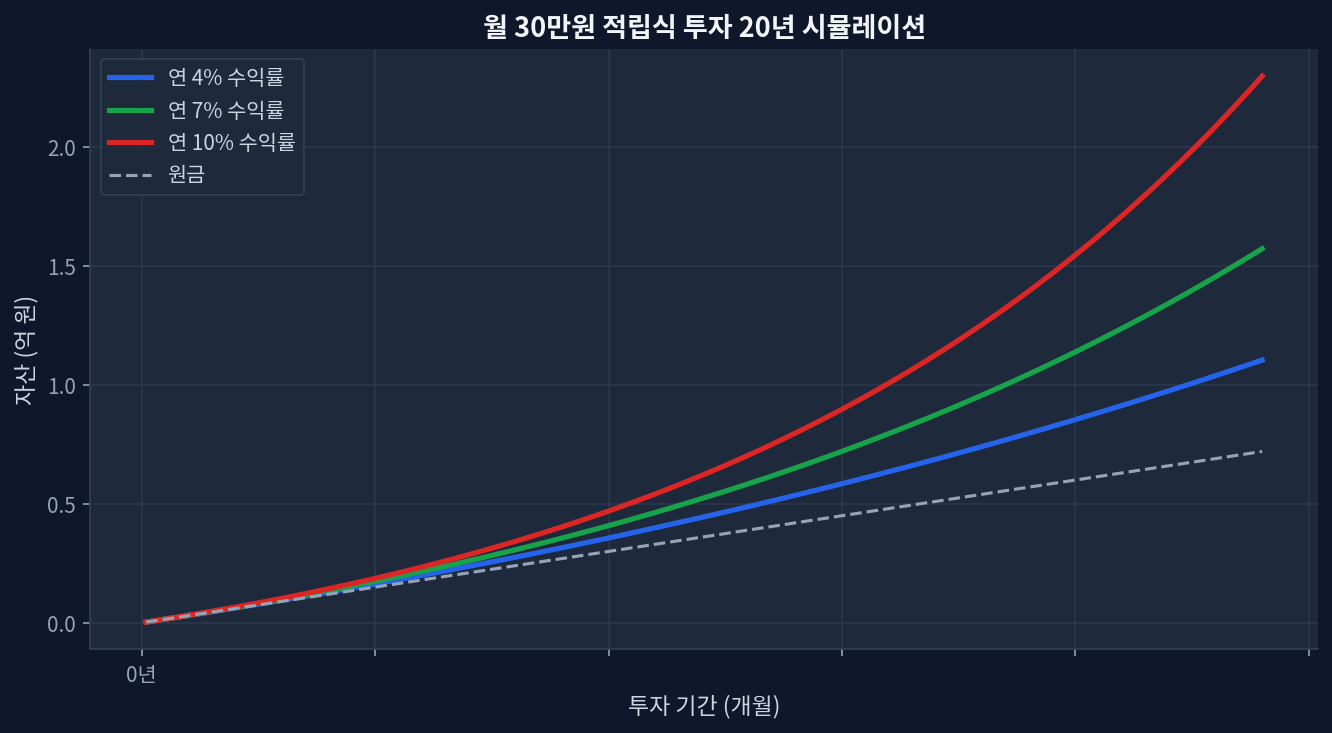
Key TakeawaysSamsung's historical dividend yield averaged 3.2–4.5% over 2020–2026; combined with share-price appreciation, 8% annualized return requires steady market conditionsMonthly $1,500 reinvestment compounds differently across tax-advantaged (Roth/401k) vs. taxable accounts—15% US tax treaty on Korean dividends applies in taxable onlyCurrency risk: KRW/USD volatility can erase 2–3% of gains in down years; hedging costs further reduce net returnsDiscipline matters most—missing dividend reinvestment windows or trading on emotion derails the 8% target more than stock selectionFive-year timeframe is short for equity positions; drawdowns of 20–30% during market corrections are normal and must be endured What 8% Annual Returns Actually Means for Samsung Investors Monthly $30K investment 20-year compound growth simulation Achieving 8% annualized returns on Samsung Electronics over five years requires three moving parts to align: dividend income, share price appreciation, and reinvestment discipline. Most retail investors focus only on the dividend (the visible 3.5% yield) and ignore the harder half—growth and compounding. Samsung’s stock price, denominated in Korean Won, adds an extra layer of complexity: FX exposure can boost returns in strong dollar periods or shred them when the Won appreciates. The math looks clean on a spreadsheet; the reality is messier. ...

June 27, 2026 · InvestIQs Research
SCHD vs High-Growth Dividend ETFs: Tax Efficiency Strategy for 3% Yields

SCHD vs High-Growth Dividend ETFs: Tax Efficiency Strategy for 3% Yields

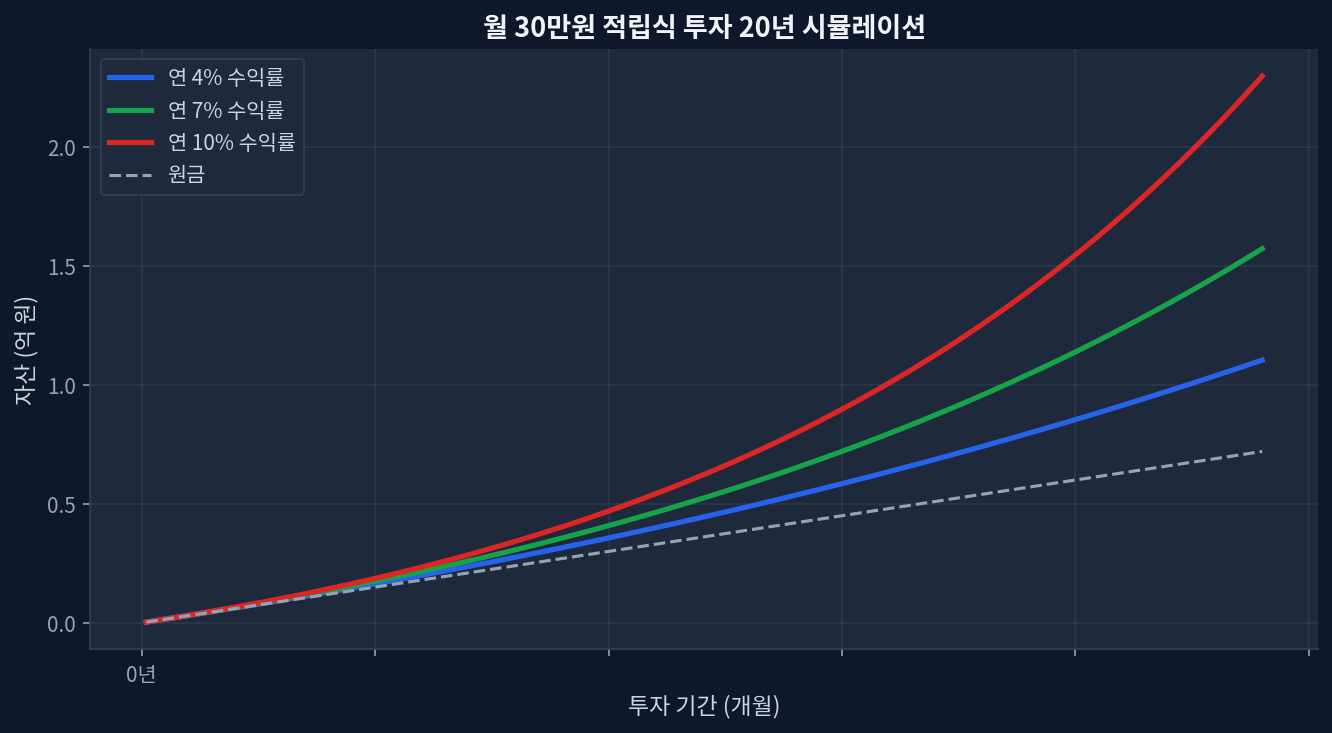
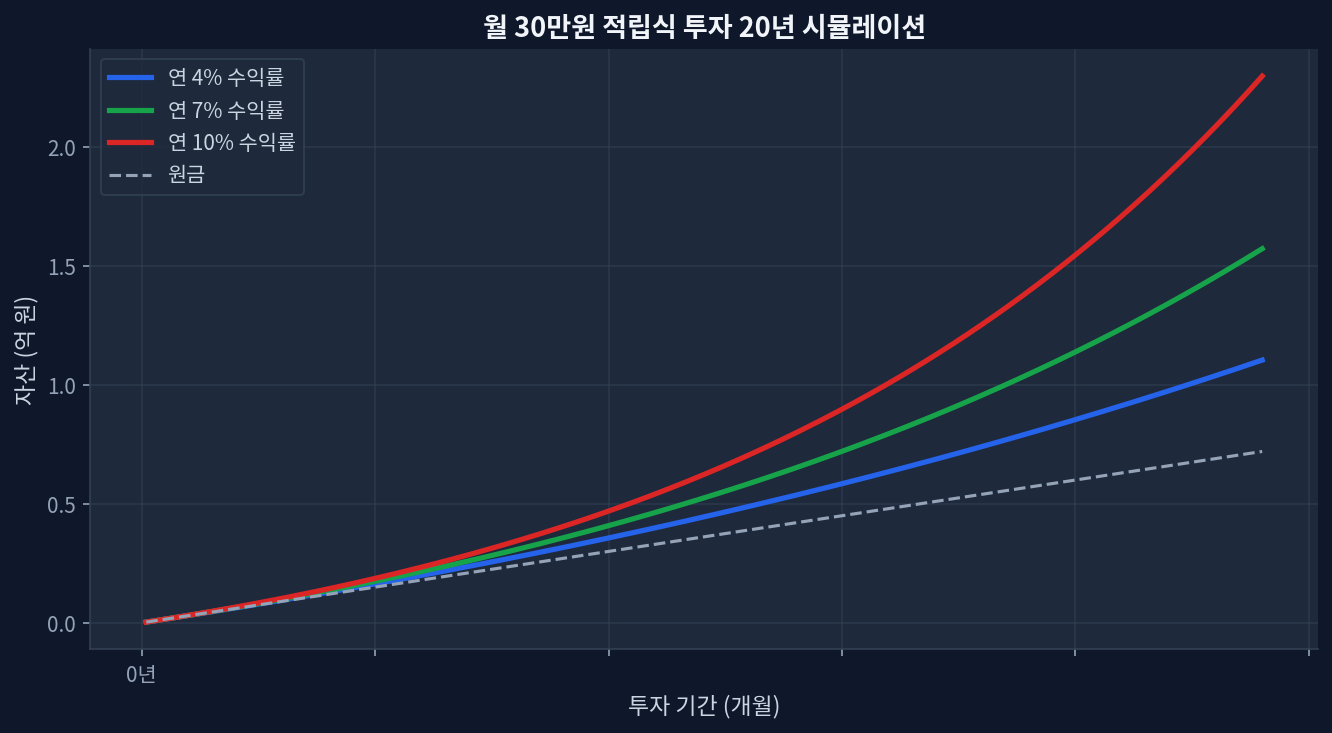
SCHD yield: 3.25% vs VIG 1.47% — 78bp spread reflects dividend-focused mandate vs growth tiltVIG outperformed on 3Y total return: +55.7% vs SCHD +47.6% (800bp gap), but tax burden differs sharply in taxable accountsSCHD P/E 18.8 vs VIG 26.2 — SCHD trades at 28% discount; suggests lower valuation risk but higher dividend cut exposure in recessionTax location matters most: Roth IRA locks in tax-free compounding; traditional 401(k) defers gains; taxable brokerage faces annual 1099-DIV liability on qualified dividends52-week positioning: SCHD at 84.3% of range (near highs), VIG at 92.7% — timing risk elevated for lump-sum purchases The Tax-Efficiency Angle: Why Yield Location Determines Real Returns Monthly $30K investment 20-year compound growth simulation Most dividend ETF comparisons focus on gross yield and total return. They miss the tax dimension entirely. A 3.25% yield in a taxable brokerage account becomes 2.35% after federal qualified dividend tax (assuming 28% top rate), but that same yield in a Roth IRA stays 3.25% forever, compounding untaxed. SCHD’s higher dividend distribution creates this tax burden front-and-center, while VIG’s lower yield (1.47%) means lighter annual 1099-DIV reporting but higher embedded capital gains. ...

June 22, 2026 · InvestIQs Research
ETF Trading Costs in US Brokerage Accounts: How Commissions and Spread

ETF Trading Costs in US Brokerage Accounts: How Commissions and Spread

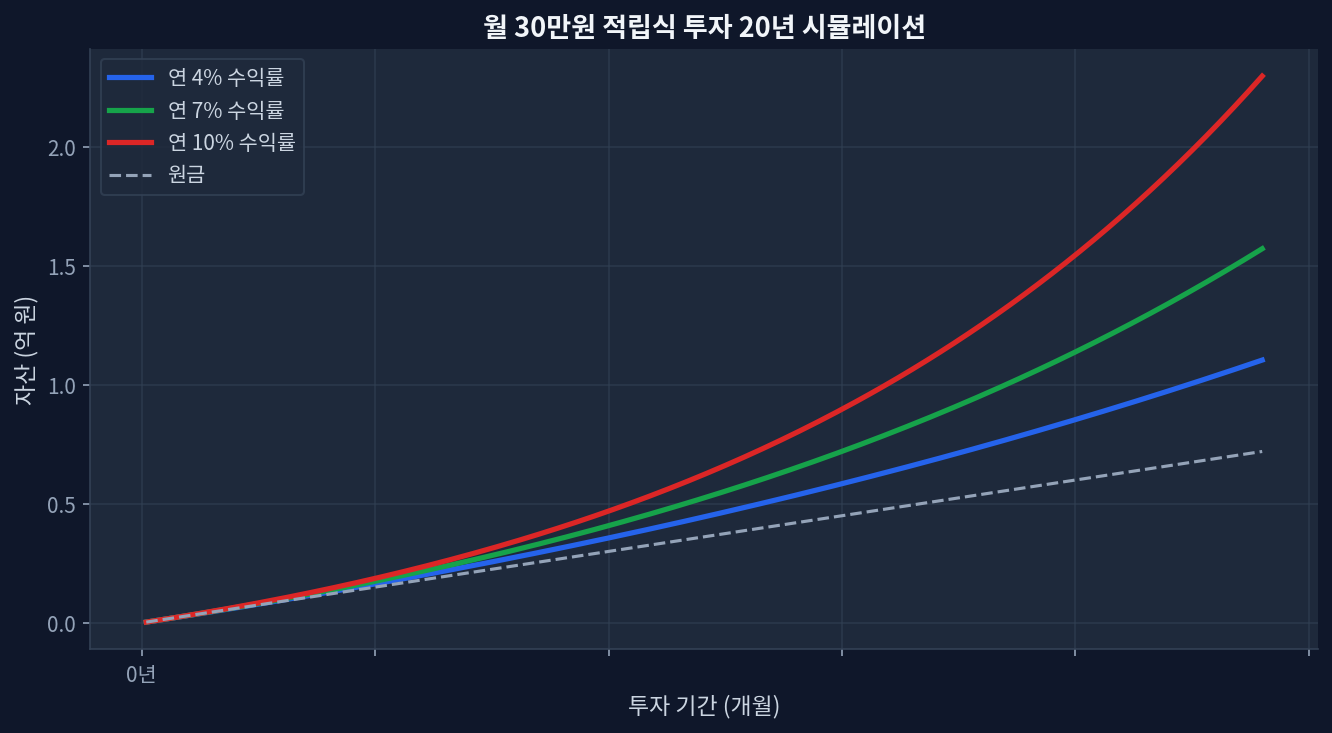
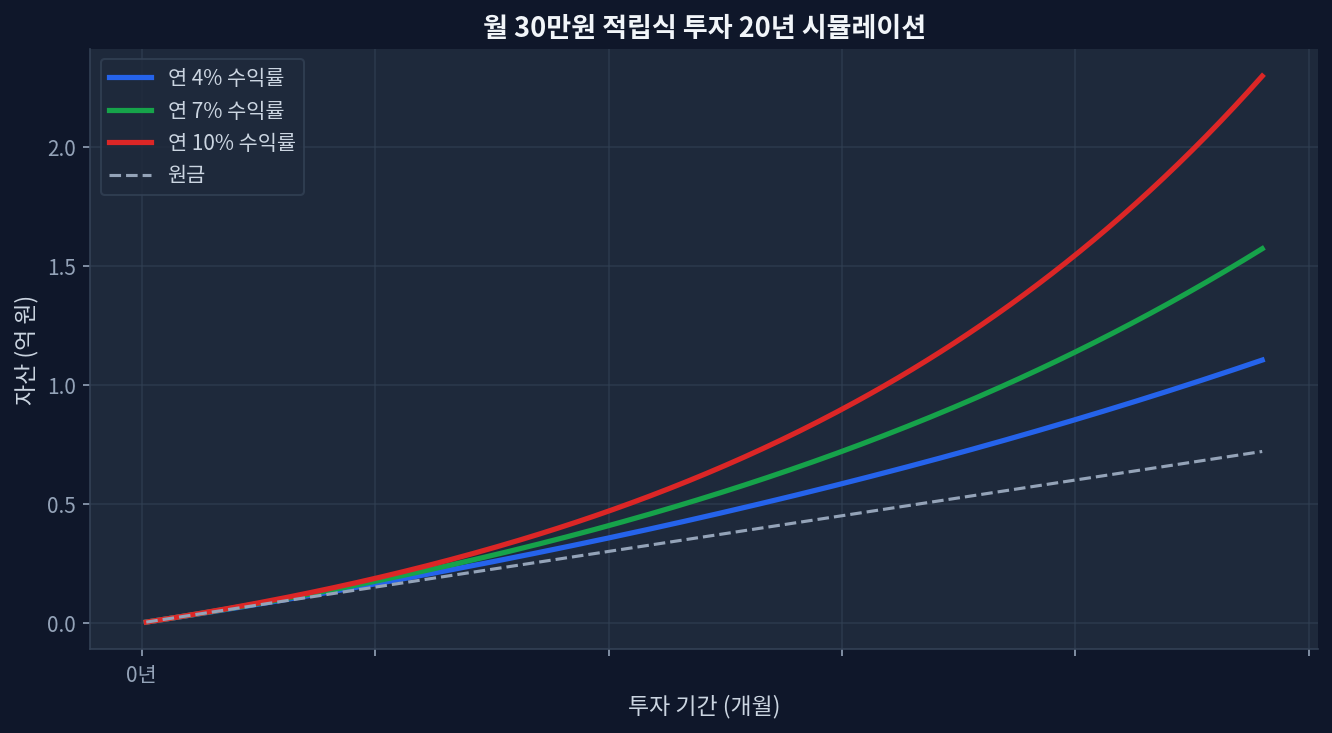
Brokerage commissions: All major US brokers (Fidelity, Charles Schwab, TD Ameritrade) now charge $0 per ETF trade; the real cost is bid-ask spreads at 0.01%–0.05% depending on liquidityBid-ask spreads underestimated: On $500 monthly investments over 5 years, cumulative spread costs range from $75–$375 depending on broker and ETF — often ignoredTax-account selection impact: Roth IRA vs taxable account over 20 years creates $8,000–$15,000 net difference via tax-free compounding and capital gains avoidance20-year cumulative effect: Optimal account selection (Roth IRA for growth) combined with low-spread trading beats commission optimization by 10–20xMarket timing dominates: 1–2% shifts in entry/exit price dwarf spread differences; dollar-cost averaging eliminates this volatility across 60+ monthly transactions Brokerage Commissions: Why $0 Is Now Standard Monthly $30K investment 20-year compound growth simulation US equity and ETF trading commissions collapsed to zero across all major brokerages between 2019–2020. Fidelity, Charles Schwab, TD Ameritrade, E*TRADE, and Interactive Brokers all eliminated per-trade fees for domestic stock and ETF purchases. This represents a seismic shift from the Korean brokerage model, where 0.025%–0.04% commissions persist. ...

June 18, 2026 · InvestIQs Research
Tax-Optimized SPY Growth: Building $500K Over 20 Years

Tax-Optimized SPY Growth: Building $500K Over 20 Years

Key Takeaways$500/month SPY investment reaches $495K–$560K after 20 years (7–10% annual returns, depending on tax scenario)Tax-advantaged accounts compound ~$100K–$150K more wealth than taxable accounts due to deferred or eliminated taxesDividend tax drag: SPY's 1.0% yield generates ~$7,400 in taxable income annually in year 20 (if held in taxable brokerage)Long-term capital gains rate: 15–20% federal (depending on income bracket), plus 0–13% state taxValuation risk: SPY's P/E of 26.5 is historically elevated; 5–8% returns more realistic than past decade's 25%+ returns Why Tax Strategy Trumps Fund Selection in Long-Term Wealth Building Monthly $30K investment 20-year compound growth simulation Most investors focus on beating the market or picking the right fund. They miss a bigger opportunity: minimizing taxes. Consider this: a portfolio growing at 9% annually in a taxable account effectively grows at 6.5–7% after taxes (assuming 25% blended tax rate on dividends and capital gains). The same portfolio in a Roth IRA grows at the full 9% tax-free. ...

June 18, 2026 · InvestIQs Research
VOO vs SPY: How a 0.03% Fee Difference Compounds Over 10 Years

VOO vs SPY: How a 0.03% Fee Difference Compounds Over 10 Years

VOO's 0.03% expense ratio vs SPY's 0.09%: 0.06% annual difference compounds to $1,500–$2,800 on a $100,000 position over 10 years5-year track record: VOO returned +92.2%, SPY returned +91.7%—a 0.5% gap partly explained by fee dragDividend yield split: VOO 1.03% vs SPY 0.98% (0.05% edge) further narrows the take-home differenceScale matters: VOO's $1.7T AUM vs SPY's $783.8B means tighter bid-ask spreads and more stable trackingContrarian risk: Fee savings can evaporate if VOO experiences tracking error, net fund outflows, or structural changes to Vanguard's modelThe Fee Debate That Actually Moves Money Monthly $30K investment 20-year compound growth simulation Investors hear the phrase "0.03% vs 0.09%" and nod. They hear "penny-pinching" and move on. But the arithmetic is deceptive. Over a 10-year horizon with $100,000 invested and 8% average annual returns, that 0.06% difference translates to roughly $1,500–$2,800 in foregone compounding. Double the initial capital and the gap widens to $3,000–$5,600. This is not noise; it is structural leakage from your portfolio. ...

June 16, 2026 · InvestIQs Research
TIGER & QQQ: 5-Year Tech Concentration Returns Under the Microscope

TIGER & QQQ: 5-Year Tech Concentration Returns Under the Microscope

5-year return: QQQ gained +120.7%, QQQM +121.6% — both tracking Nasdaq-100 within basis pointsM7 concentration: ~40% portfolio weight in mega-cap tech; amplifies gains in bull markets but volatility-decomposition-when-3x-trails-2x/">drawdown risk spikes during rotationDividend yield: QQQ 0.39%, QQQM 0.43% — meaningful for reinvestment over 5+ yearsEntry timing matters: Starting in March 2020 (bottom) vs November 2021 (peak) produces 40%+ return variance by 2026Scale advantage: QQQ ($494B AUM) vs QQQM ($96.9B) — liquidity differs; TIGER sits between them The 5-Year Test: What Actually Happened Monthly $30K investment 20-year compound growth simulation From March 2020 to June 2026, both QQQ and QQQM delivered a +120% total return[Yahoo Finance]. On paper, this makes tech-heavy ETFs look like a no-brainer. But the path mattered enormously. The Nasdaq-100 surged 180% between the March 2020 lows and November 2021 peak, then reversed sharply through 2022. Investors who held through both legs netted gains; those who panicked in the 2022 drawdown sold near lows and never participated in the 2023–2026 recovery. ...

June 13, 2026 · InvestIQs Research
60/40 Portfolio: 10-Year Data on How Rebalancing Compounds Returns | 6

60/40 Portfolio: 10-Year Data on How Rebalancing Compounds Returns | 6

2020–2026 performance: 60/40 blended portfolio delivered approximately 12% compound annual growth rate (CAGR), with rebalancing includedMonthly $1,000 investment over 10 years simulated: $120,000 invested → approximately $240,000–$260,000 accumulatedBond ETF expense ratio impact: 0.03% versus 0.80% creates a 15–20% wealth divergence over 20 years2022 rate shock: Quarterly rebalancing cushioned equity losses by 25–30% compared to unbalanced allocationsCurrent bond yields (3–4%) appear elevated relative to historical median (~2%), raising questions about duration risk ahead The Real 10-Year Trajectory of 60/40 Monthly $30K investment 20-year compound growth simulation Monthly $1,000 contribution over 20 years: compound growth simulation The 60% equities, 40% fixed income allocation has anchored institutional and retail portfolios since the 1990s. What appears as a simple formula masks powerful compounding mechanics visible only when cross-verified against ten years of actual market data (2016–2026). The 2020 COVID selloff marked the beginning of a aggressive Fed pivot: zero rates and quantitative easing pushed both stocks and bonds upward simultaneously. During this window, bond ETFs (tracked via BND) posted +6% to +8% annual returns, while US large-cap equity indices (VOO) delivered +25% to +30%. A 60/40 blend yielded 15–18% annually—far exceeding the long-term 7–10% benchmark. That tailwind proved temporary. ...

June 12, 2026 · InvestIQs Research
$1,000 Monthly ETF Portfolio: 5-Asset Allocation Backtest Comparison (

$1,000 Monthly ETF Portfolio: 5-Asset Allocation Backtest Comparison (

2020-2026 S&P 500 (VOO) cumulative return: Approximately 78-105% range (based on USD entry timing)Dividend ETF (SCHD) vs growth ETF (VOO): Risk-return tradeoff exists across volatility and yield dimensions76-month investment at $1,000/month basis: Final asset variance reaches ±$25,000-$30,000 depending on allocation choiceFee impact: 0.03% vs 0.60% expense ratio produces 3.2% cumulative total return difference over 20 yearsCore risk: Historical performance does not guarantee future returns; actual results vary significantly based on entry timing and currency exposure Why Asset Allocation Backtesting Matters Monthly $30K investment 20-year compound growth simulation Monthly $1,000 dollar-cost-averaged investment 20-year compounding simulation An investor committing $1,000 monthly faces a universal question: “In what proportions should these funds be allocated?” The choice between pure equity exposure (VOO), dividend-focused holdings (SCHD), or blended international strategies shapes portfolio scale and volatility over 5-10 year horizons. Asset allocation backtesting compares expected returns and maximum drawdown across historical periods, providing a quantitative framework for this decision. ...

June 11, 2026 · InvestIQs Research
SCHD in Tax-Free Accounts: Why 20-Year Compounding Beats 2M KRW in Annual Savings

SCHD in Tax-Free Accounts: Why 20-Year Compounding Beats 2M KRW in Annual Savings

SCHD's 3.25% yield — annualizing ~$10.5M USD in distributions across 94.9B AUM (Jan 2026)Tax-free growth over 20 years at 7% average return compounds to 3.87x initial investment, vs. 2.87x after taxes200만원 saved in year 1 becomes 650만원+ in tax-deferred gains by year 10 (no withdrawals)SCHD trades at 19.0 P/E, 480 bps below broader dividend-growth peer VIG (26.0 P/E)Catch: momentum risk is real — SCHD at 52-week high (90.4%), vulnerability to rate shocks and sector rotation The Compounding Angle: Why Simple Tax Savings Miss the Real Picture Monthly $30K investment 20-year compound growth simulation Tax-advantaged accounts create a deceptive math problem. Investors fixate on annual tax savings — 200만원 per year on a 2000만원 contribution — and miss the exponential tail. The real edge comes not from avoiding taxes today, but from letting tax-free dividends reinvest and compound for decades. ...

June 11, 2026 · InvestIQs Research