TQQQ’s 5-Year Drawdown and Volatility Breakdown: Where 3x Lagged 2x
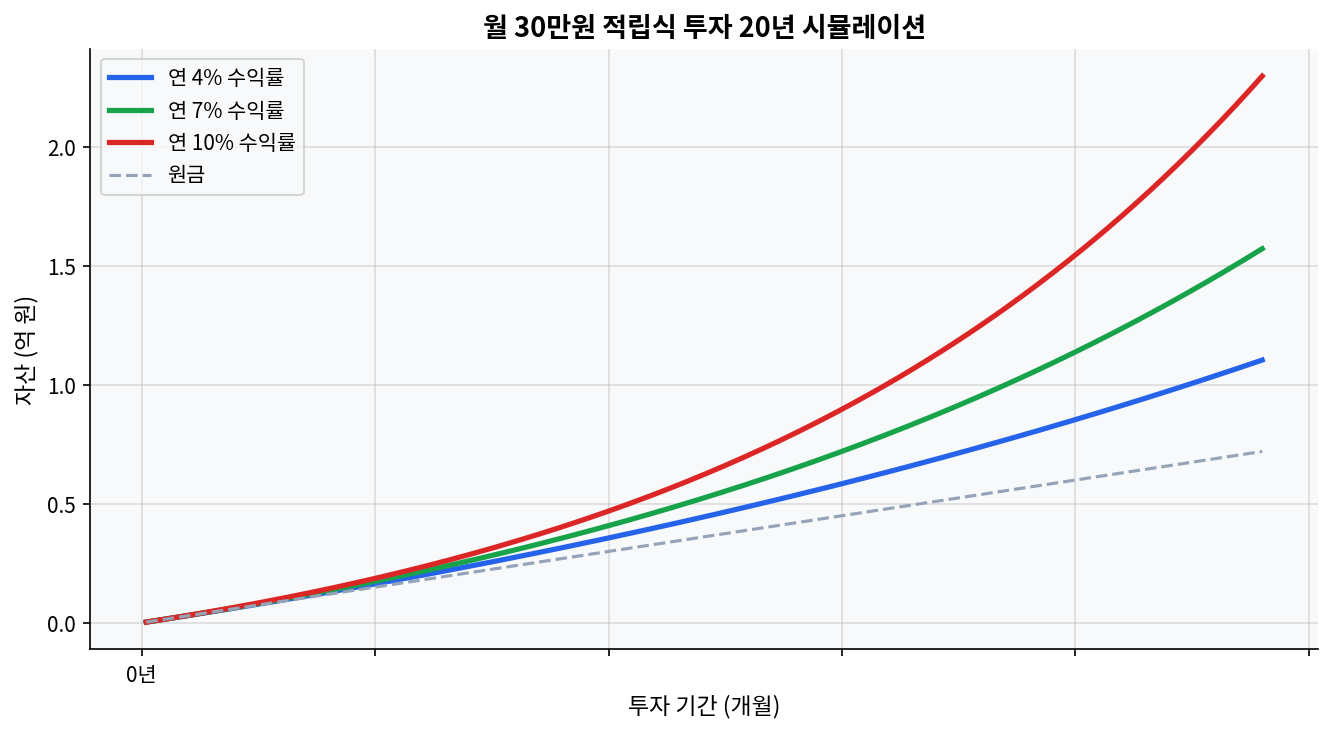
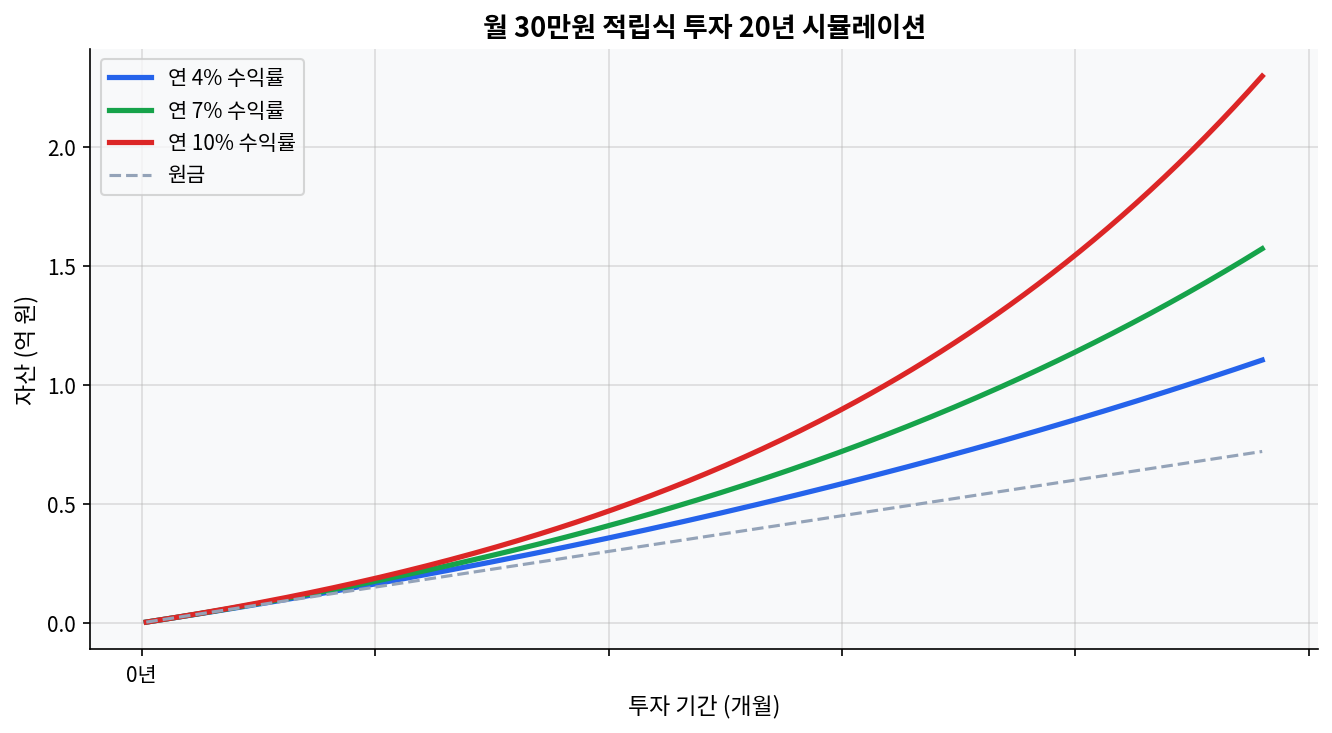
As of 2026-04-21, TQQQ’s five-year total return was 120.40%, with a CAGR of 16.57%.As of 2026-03-31, TQQQ’s five-year maximum drawdown was 81.65%, versus 35.12% for QQQ, or 2.33x deeper.Five-year annualized monthly volatility came in at 61.28% for TQQQ, 20.23% for QQQ, and 40.61% for QLD.Over the same five-year window, QLD outpaced TQQQ with a 137.48% total return and an 18.77% CAGR.Dividend yield was roughly 0.53% for TQQQ, 0.15% for QLD, and 0.43% for QQQ, which is why the real story in leveraged ETFs is path dependence, not cash flow. The Two Charts Say It First Monthly investment 20-year compound growth simulation Comparison of how ETF fee differences affect long-term wealth The first chart shows the 20-year wealth gap between a 0.05% ETF fee and a 1.0% fee. The second shows how monthly investing of $300 compounds very differently at 4%, 7%, and 10% over time. In a TQQQ discussion, those charts are not background material. For leveraged ETFs, costs and path shape the capital curve faster than the return table suggests. Even when TQQQ rallies hard between 2020 and 2026, the first question is how much damage a single 2022-style crash can do to the long-term line. ...