JEPI Quarterly Dividend Raised 10.3%, Yet Growth Stagnation Signals Ca

JEPI Quarterly Dividend Raised 10.3%, Yet Growth Stagnation Signals Ca

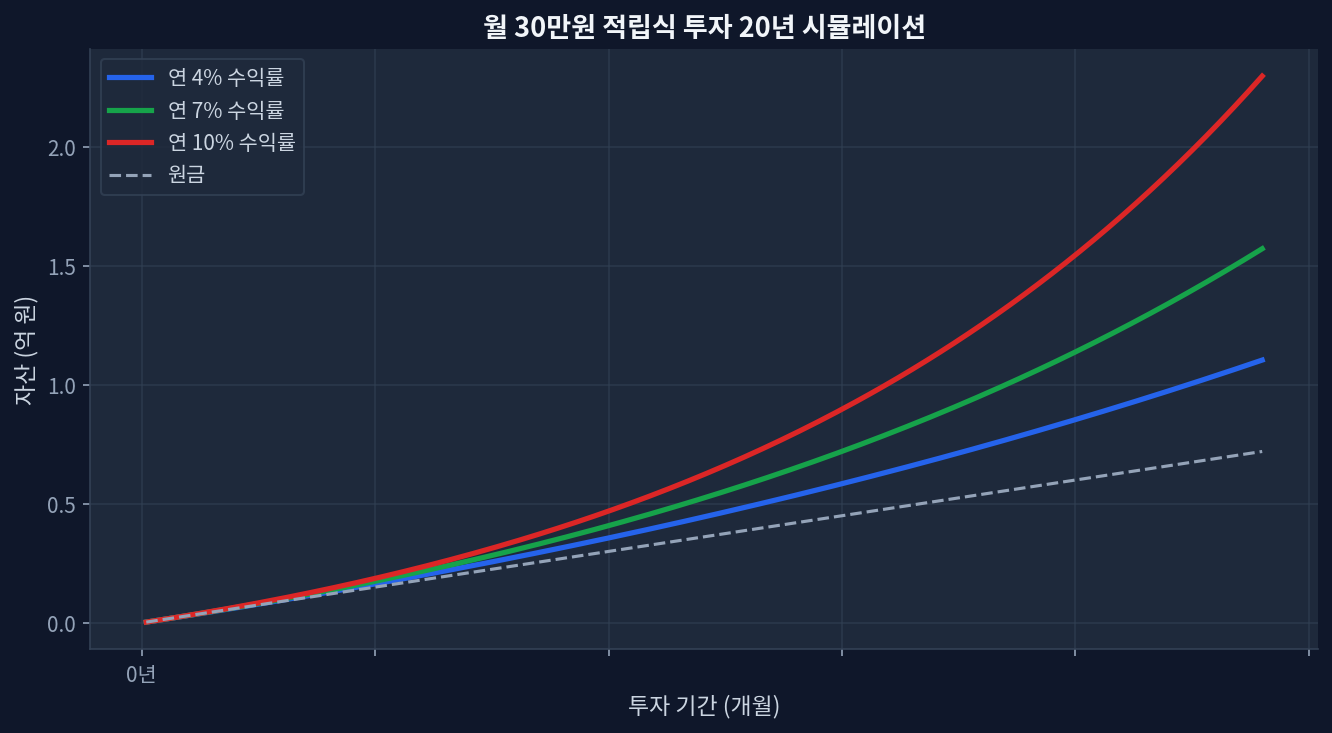
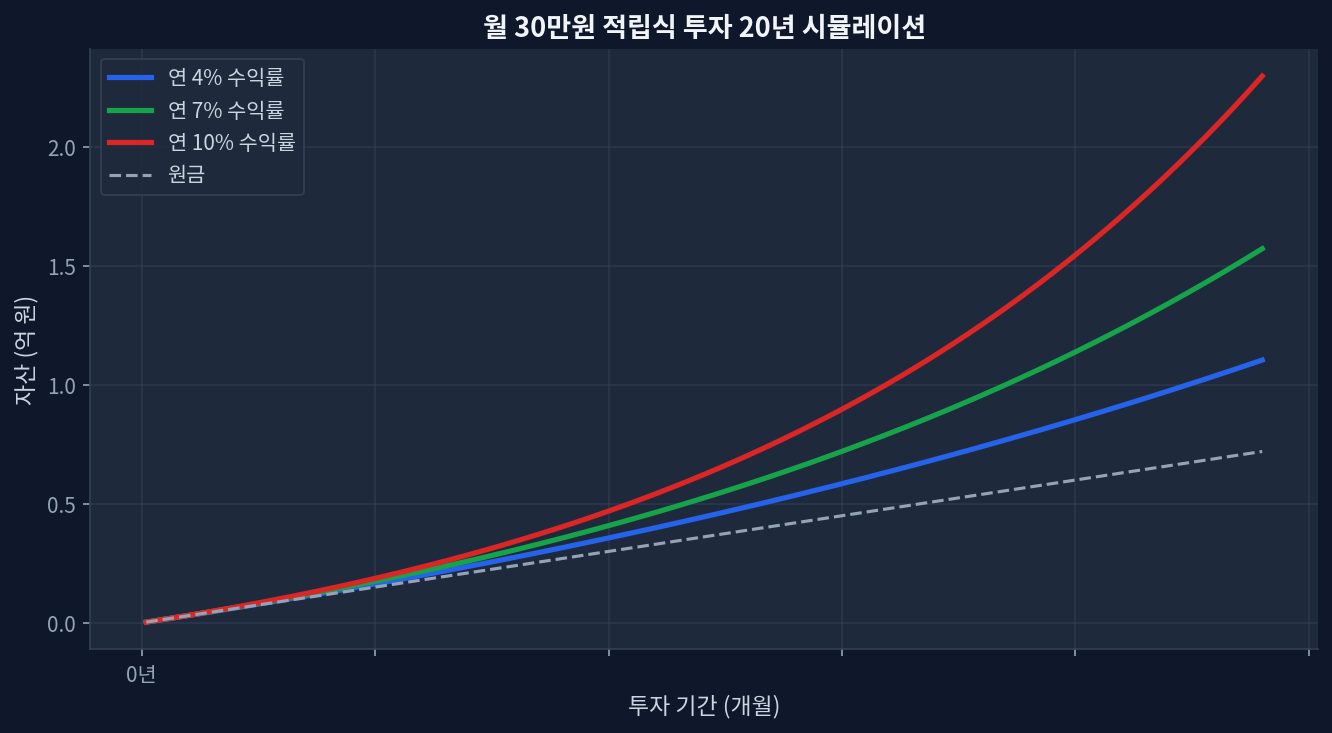
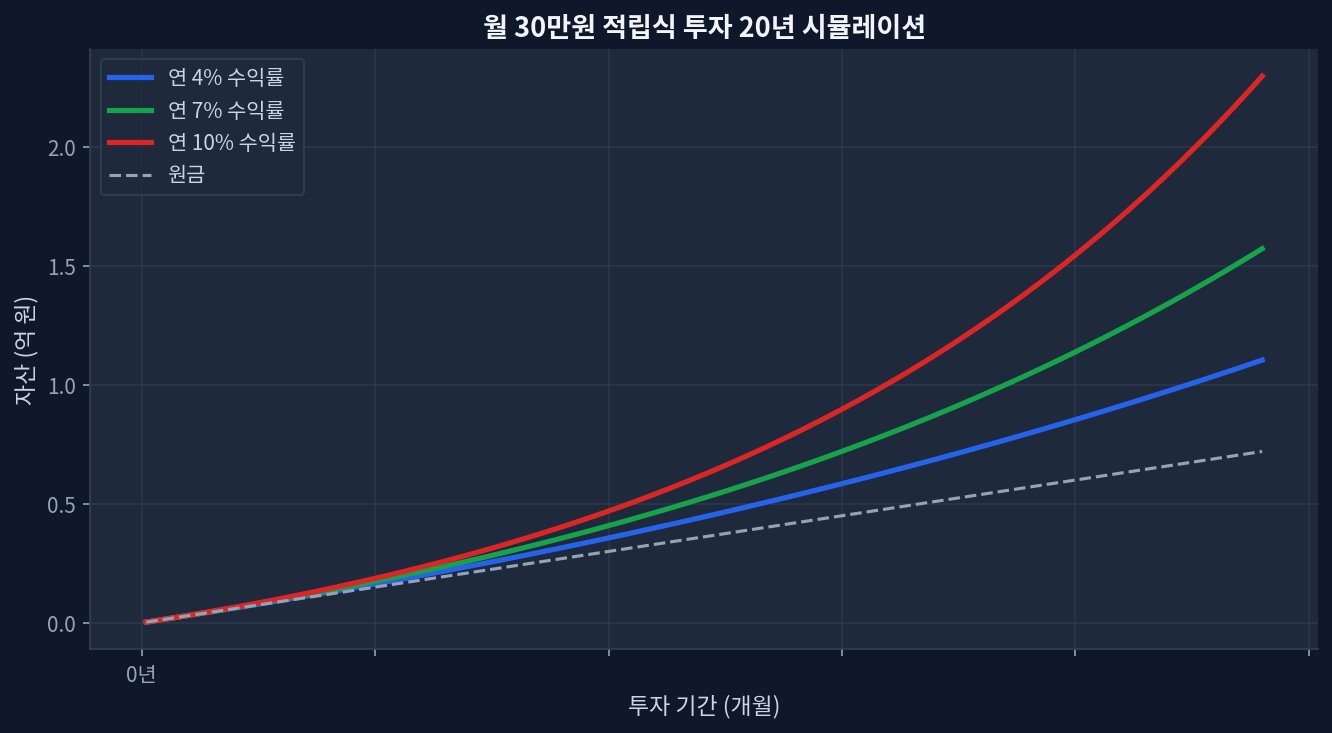
schd-deconstructing-covered-call-premium-costs-in-a-5-year-data-review/">JEPI quarterly dividend announcement: $0.3870 (+10.3% year-over-year increase)Current dividend yield: 8.08% (elevated) vs. 1-year total return: +7.4% (weak)5-year cumulative return: +42.5% vs. SCHD +54.9% (2.4% annualized gap)P/E ratio 26.8 (40% premium to SCHD's 19.0); trading at 30.2% of 52-week range (bearish signal)Cash outflow pressure: elevated dividend payments reduce retained capital, weakening share price defense The Structural Dilemma Hidden in Dividend Growth Monthly $30K investment 20-year compound growth simulation Monthly $2,000 Recurring Investment Over 20 Years: Compound Growth Simulation JEPI’s quarterly dividend increase to $0.3870 appears favorable on the surface. A 10.3% jump from the prior-year quarter’s $0.3508 demonstrates consistency. Yet for a $44.7 billion ETF to draw attention primarily on dividend growth itself represents a structural problem. ...
July 19, 2026 · InvestIQs Research
JEPQ's 25.1% Dividend Hike: The Hidden Mechanics Behind 9.95% Yield

JEPQ's 25.1% Dividend Hike: The Hidden Mechanics Behind 9.95% Yield

Quarterly Dividend: $0.6370 announced, up 25.1% year-over-year Dividend Yield: 9.95% vs JEPI 8.08% (JEPI shows superior dividend stability) 1-Year Total Return: JEPQ +19.0% vs JEPI +7.4% (JEPQ demonstrates higher aggressiveness) Current Price: $58.51, 5.2% below 52-week high of $61.72 Critical Caveat: High dividend relies on option premium generation—sharp drawdowns carry significant distribution cut risk JEPQ (JPMorgan Nasdaq-100 Options Income ETF) announced a quarterly dividend of $0.6370, representing a 25.1% year-over-year increase. This translates to a stated dividend yield of 9.95%. Among retail investors encountering this data for the first time, a recurring question surfaces: “With S&P 500 dividend yields languishing near 1.4%, is a 9.95% yield truly compelling, or does it mask structural fragility?” ...

July 18, 2026 · InvestIQs Research
JEPI's $0.3890 Dividend Increase: Reassessing Income and Growth Mechan

JEPI's $0.3890 Dividend Increase: Reassessing Income and Growth Mechan

JEPI announced a quarterly dividend of $0.3890, representing a 13.1% increase year-over-year. Covered call strategies typically face skepticism regarding income sustainability and total return potential. However, JEPI's dividend growth rate signals a shift in market mechanics. This warrants a reassessment of its role within broader portfolio construction. ...

June 14, 2026 · InvestIQs Research

Portfolio Income Calculator — Estimate Blended Dividend Yield

Why blended yield matters When you hold multiple dividend ETFs, each with a different yield and expense ratio, the income your portfolio actually generates depends on how much you have in each. A blended yield — weighted by your dollar amounts — gives a more accurate picture than looking at any single ETF in isolation. This tool does that math for you. ...

June 14, 2026 · InvestIQs Editorial

JEPI Dividend Calculator — Dividend Reinvestment Simulation

See JEPI’s dividends in numbers JEPI (JPMorgan Equity Premium Income ETF) generates income by combining a low-volatility U.S. equity portfolio with an options-overlay (equity-linked notes). The result is a high distribution and smoother ride, but capped upside in strong rallies. ...

June 14, 2026 · InvestIQs Editorial

JEPI vs JEPQ — ETF Comparison

JEPI vs JEPQ: Key Differences JEPI and JEPQ share the same JPMorgan equity-premium-income strategy but differ in their equity base. JEPI uses a low-volatility U.S. stock portfolio; JEPQ applies the same overlay to Nasdaq-100-style holdings. ...

June 14, 2026 · InvestIQs Editorial

SCHD vs JEPI — ETF Comparison

SCHD vs JEPI: Key Differences SCHD and JEPI represent two distinct income approaches. SCHD pursues dividend growth through equity ownership; JEPI supplements equity income with an options overlay to deliver a higher monthly distribution. ...

June 14, 2026 · InvestIQs Editorial
Volatility and Risk in Monthly Dividend ETFs: The Yield vs. Total Retu

Volatility and Risk in Monthly Dividend ETFs: The Yield vs. Total Retu

JEPQ recorded a 10.33% dividend yield and a 78.0% 3-year cumulative total return, demonstrating a strong outperformance trajectory in a high-volatility market environment.JEPI yielded 8.29% with a 1-year total return of only 8.5%, exposing the structural risk of covered calls where returns are compromised by upside capping.Empirical data supports that underlying asset P/E valuations and volatility (VIX) regime shifts are the core factors determining long-term total return, rather than superficial high dividend yields. The most critical cognitive error observed in the monthly dividend ETF market is the blind faith that the size of the yield equates to the actual return on investment. [ETF.com] Covered call ETFs that pay high monthly dividends fundamentally possess a derivative structure, selling future upside volatility to collect a cash premium in the present. Therefore, an allocation strategy that solely chases superficial yield metrics while ignoring the fundamental risk of underlying assets and macroeconomic volatility regimes will inevitably face the structural limitation of long-term capital erosion. Based on real-time data from major monthly dividend ETFs currently recording the highest AUM, this research presents analysis that counters popular consensus from a risk-reward perspective. ...

May 18, 2026 · InvestIQs Research
QYLD and the 8% Dividend Trap: What Five Years of Total Return Data Actually Shows

QYLD and the 8% Dividend Trap: What Five Years of Total Return Data Actually Shows

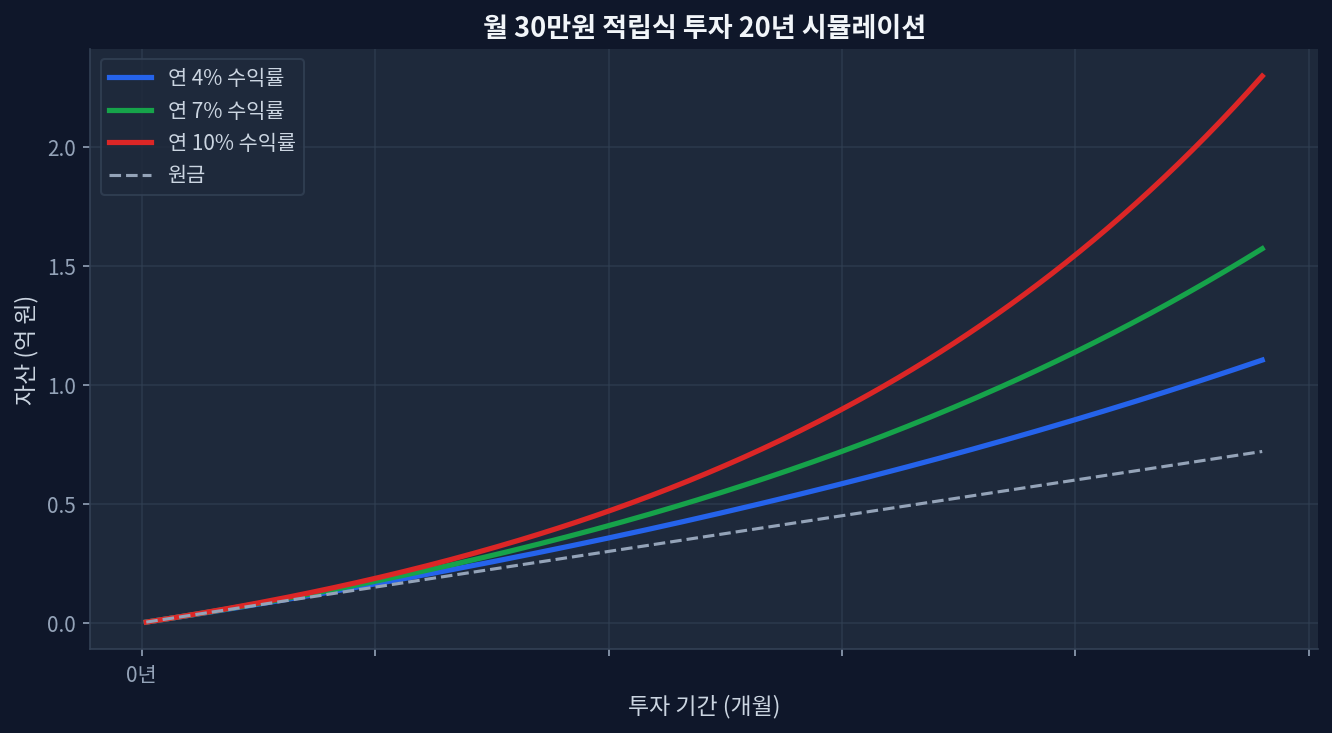
QYLD delivered ~21% total return (2020–2024) vs. SPY's ~96% — a 75-point gap the 10%+ yield never bridges.Covered call distributions tax as ordinary income; at the 22% federal bracket, after-tax yield on QYLD falls to ~8% before NAV erosion.JEPI (0.35% ER) posted ~55% total return since May 2020 inception vs. QYLD's ~21%, with partial qualified-dividend treatment.Account placement dominates ticker selection: QYLD inside a Roth IRA eliminates the ordinary-income drag entirely.Disconfirming scenario: sustained VIX above 25 expands covered call premiums and improves QYLD's yield-vs-NAV trade-off materially. The 8% Number That Hides a 75-Point Return Gap Monthly $30K investment 20-year compound growth simulation QYLD — Global X NASDAQ-100 Covered Call ETF — distributes between 10–12% annualized. That figure leads every yield screen. The problem surfaces when total return enters the picture.[ETFdb] ...

May 16, 2026 · InvestIQs Research
JEPI vs. SCHD: Deconstructing Covered Call Premium Costs in a 5-Year Data Review

JEPI vs. SCHD: Deconstructing Covered Call Premium Costs in a 5-Year Data Review

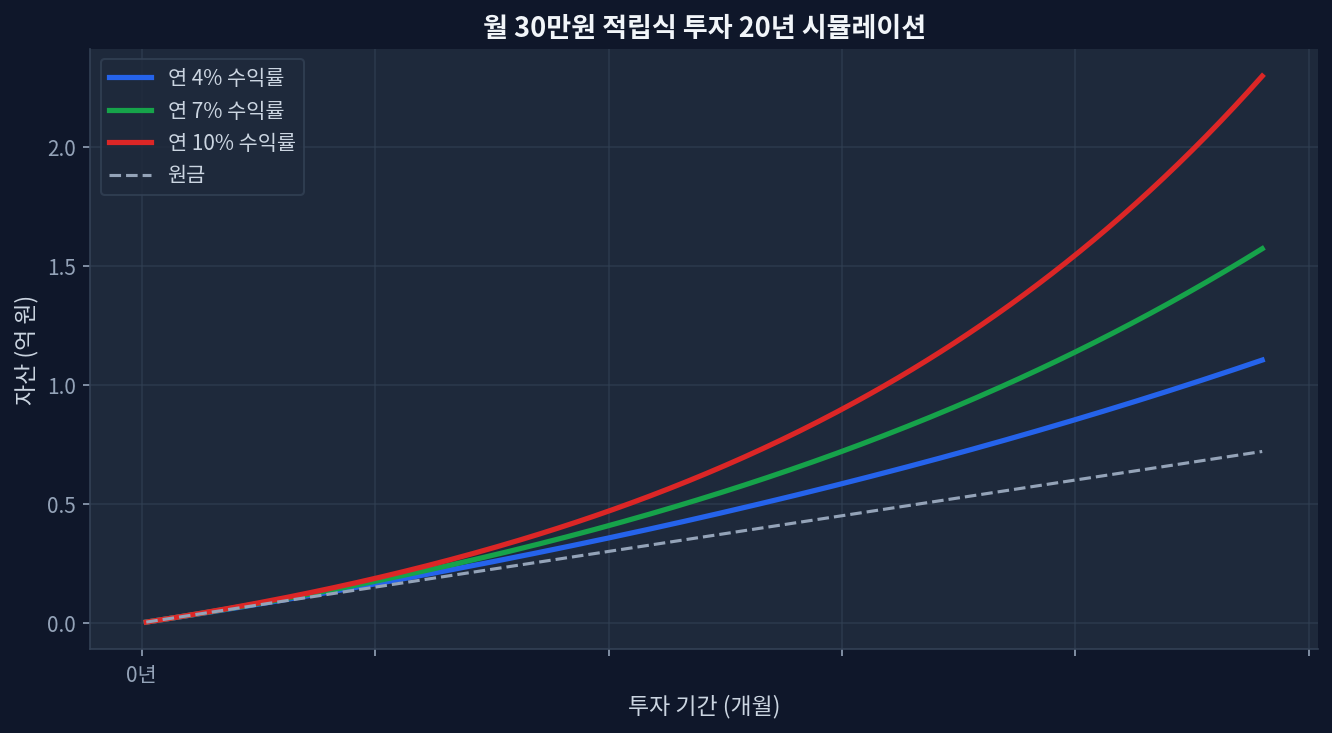
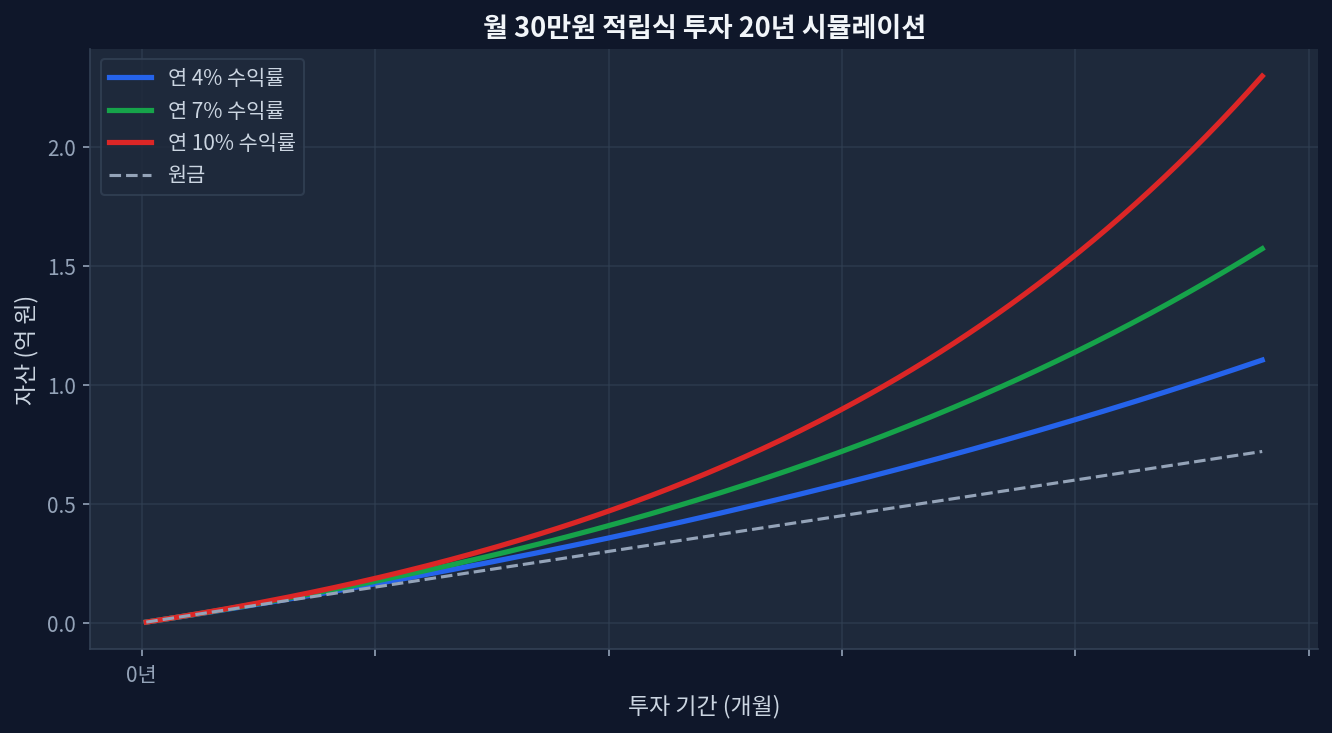
Over a five-year period, SCHD demonstrated a cumulative return of +47.6%, slightly exceeding JEPI's +44.3%. JEPI currently offers a significantly higher dividend yield at 8.29%, compared to SCHD's 3.29%, reflecting distinct income generation strategies. In the most recent one-year period, SCHD's return of +24.8% substantially outpaced JEPI's +8.4%, highlighting performance divergence in specific market conditions. The higher yield of JEPI is primarily derived from selling covered call options, introducing a unique premium cost dynamic not present in SCHD's traditional equity holdings. Analyzing JEPI and SCHD: A Five-Year Performance Overview Monthly $30K investment 20-year compound growth simulation Investors frequently evaluate exchange-traded funds (ETFs) like JEPI and SCHD for their distinct approaches to income and growth. A five-year review of their performance and underlying strategies reveals critical differences in total return, income generation, and risk profiles. Focusing on the period up to May 2026, both ETFs have delivered positive cumulative returns, yet their paths to achieving these outcomes vary significantly. SCHD, primarily a dividend growth fund, achieved a 5-year cumulative return of +47.6% [Yahoo Finance: SCHD]. In parallel, JEPI, which employs an equity-linked note (ELN) strategy involving covered calls, posted a 5-year cumulative return of +44.3% [Yahoo Finance: JEPI]. The proximity of these long-term figures often belies the fundamental differences in how these returns were generated. A twenty-year simulation of monthly 300,000 KRW investments at varying annual returns (4%/7%/10%) would illustrate divergent wealth accumulation paths, a critical consideration when evaluating these ETFs. ...

May 13, 2026