VTI vs VXUS: 15-Year Return Data and the Tax Placement Gap Most Portfolios Ignore
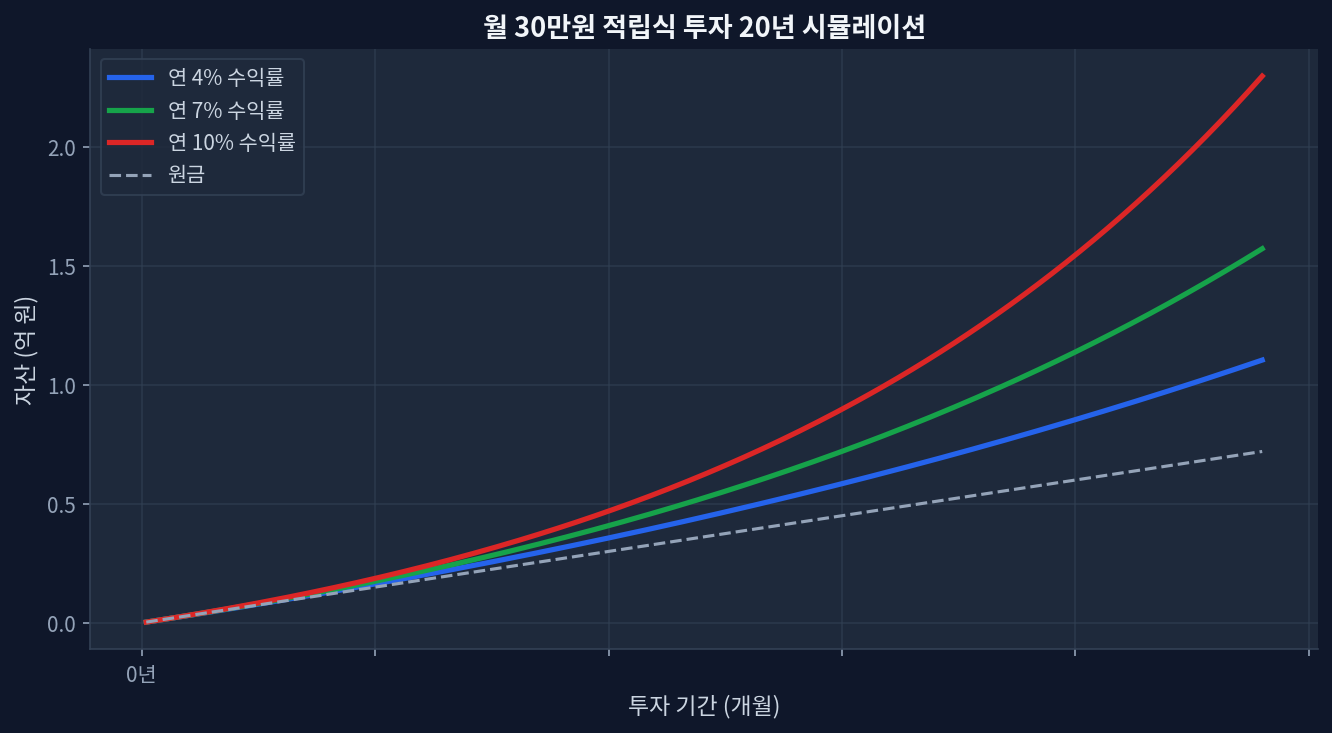
VTI 5Y return: +78.9% vs VXUS +51.1% — but VXUS leads on 1Y at +33.5% vs VTI +27.6%, a reversal worth interrogating.VXUS yields 2.69% vs VTI 1.03% — 2.6x higher income generates greater annual tax drag in taxable accounts.Valuation gap: VTI P/E 28.5 vs VXUS 18.7 — a 52% US premium, historically wide by post-2000 standards.Foreign tax credit from VXUS dividends is recoverable only in taxable brokerage accounts; permanently forfeited inside Roth IRA or 401(k).AUM: VTI $2,202.6B vs VXUS $629.1B — scale gap reflects US home bias more than quality difference. The Performance Split — And the 1-Year Flip That Challenges the Narrative Monthly $30K investment 20-year compound growth simulation The 20-year DCA simulation chart above — modeling $1,500 monthly at 4%, 7%, and 10% annual returns — illustrates how the VTI/VXUS allocation decision quietly reshapes terminal wealth over decades. The multi-year data gives VTI the unambiguous edge. Five-year cumulative: +78.9% vs VXUS’s +51.1%. Three-year: +86.1% vs +66.7%. That 20-30 percentage point spread is not noise — it compounds into a materially different retirement outcome.[Yahoo Finance] ...