VOO vs SPY: How a 0.03% Fee Difference Compounds Over 10 Years
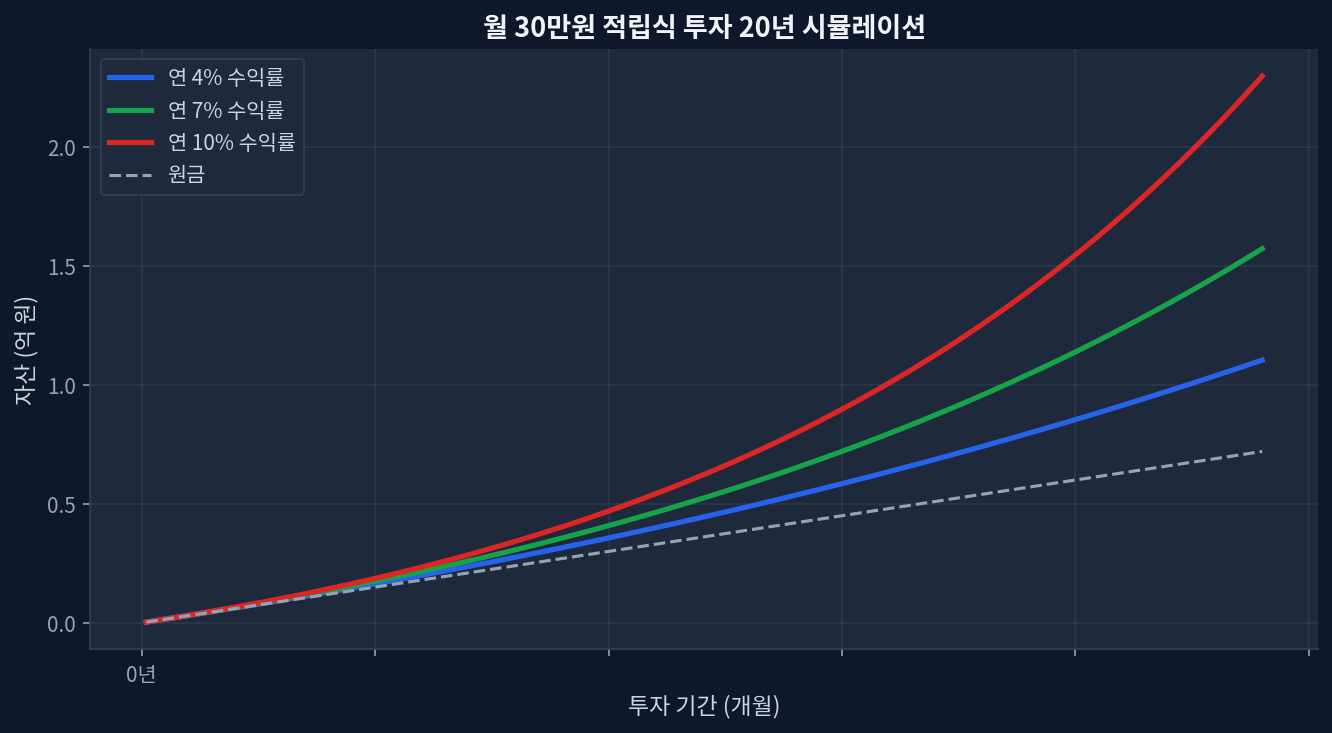
VOO's 0.03% expense ratio vs SPY's 0.09%: 0.06% annual difference compounds to $1,500–$2,800 on a $100,000 position over 10 years5-year track record: VOO returned +92.2%, SPY returned +91.7%—a 0.5% gap partly explained by fee dragDividend yield split: VOO 1.03% vs SPY 0.98% (0.05% edge) further narrows the take-home differenceScale matters: VOO's $1.7T AUM vs SPY's $783.8B means tighter bid-ask spreads and more stable trackingContrarian risk: Fee savings can evaporate if VOO experiences tracking error, net fund outflows, or structural changes to Vanguard's modelThe Fee Debate That Actually Moves Money Monthly $30K investment 20-year compound growth simulation Investors hear the phrase "0.03% vs 0.09%" and nod. They hear "penny-pinching" and move on. But the arithmetic is deceptive. Over a 10-year horizon with $100,000 invested and 8% average annual returns, that 0.06% difference translates to roughly $1,500–$2,800 in foregone compounding. Double the initial capital and the gap widens to $3,000–$5,600. This is not noise; it is structural leakage from your portfolio. ...
