JEPI's 10.3% Dividend Hike Masks Troubling Total Return Gap vs. SCHD

JEPI's 10.3% Dividend Hike Masks Troubling Total Return Gap vs. SCHD

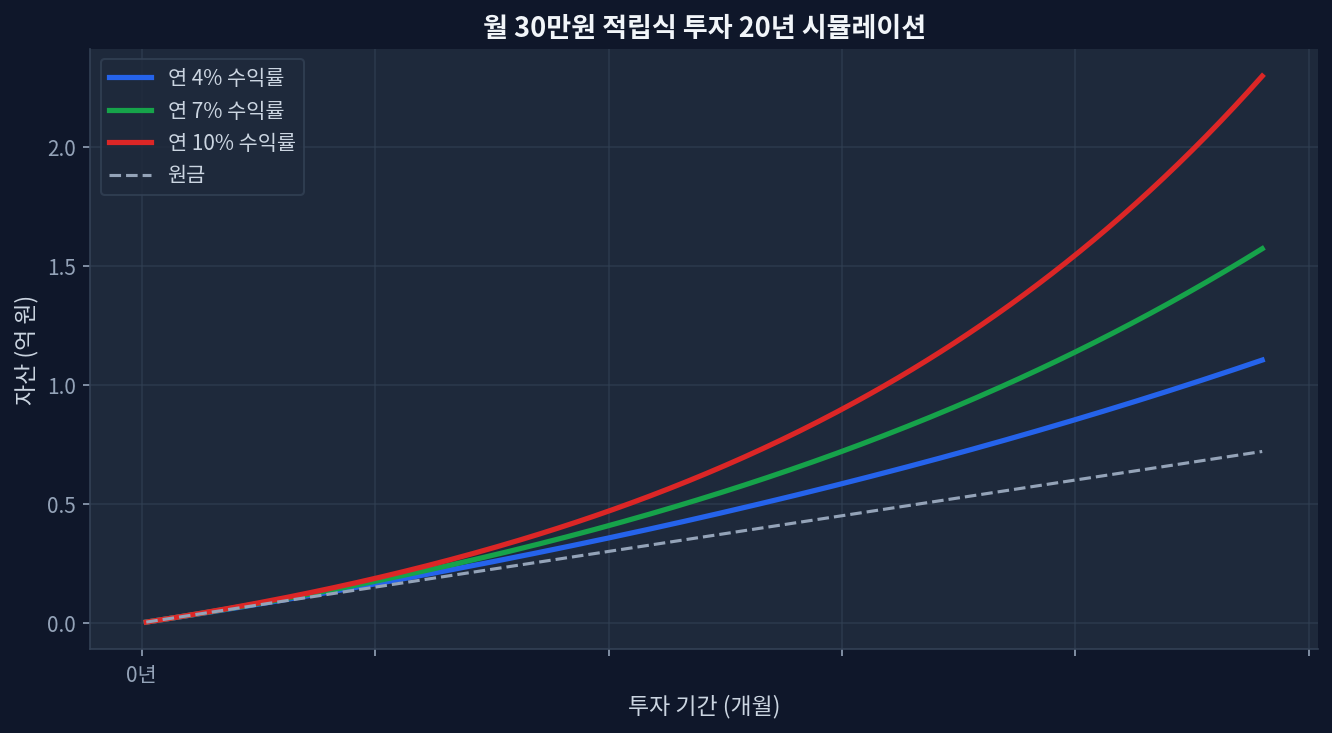
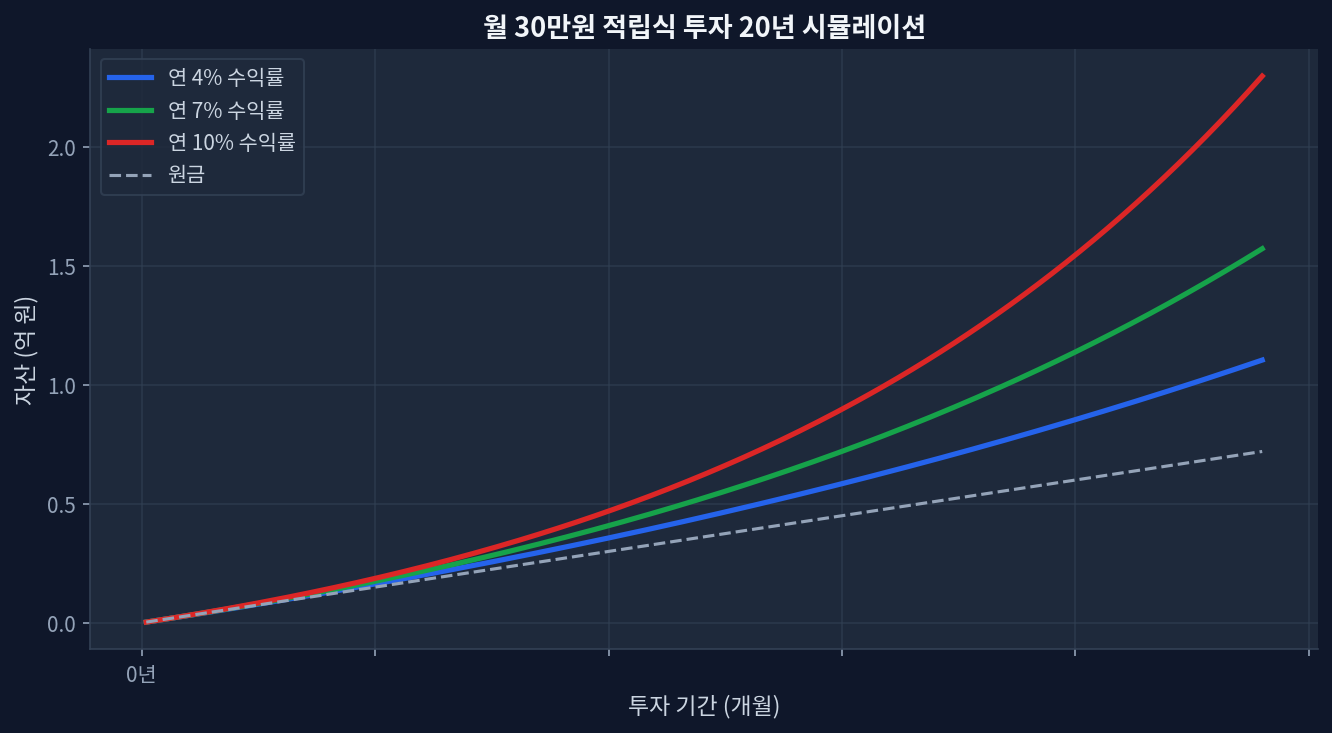
JEPI quarterly dividend raised to $0.3870 (up 10.3% year-over-year)Current dividend yield: 8.08% (elevated) vs 1-year total return: +7.4% (weak)5-year cumulative return: +42.5% vs SCHD +54.9% (2.4%p annual underperformance)P/E ratio 26.8 (SCHD 19.0) represents 40% valuation premium; trading at 30.2% of 52-week range (multi-year low)Cash extraction pressure: elevated dividend payouts compress capital preservation capacity, weakening price support The Structural Dilemma Behind the Dividend Raise Monthly $30K investment 20-year compound growth simulation 20-year monthly investment simulation showing dividend and capital gain divergence JEPI’s quarterly dividend increase to $0.3870—a 10.3% rise from the prior-year $0.3508—presents as a positive signal on the surface. Yet for a $44.7 billion ETF to merit attention primarily for a dividend raise already signals a deeper issue. ...
July 20, 2026 · InvestIQs Research
SCHD Dividend Cut of -2.7% Yet Yield Holds at 3.25%: Dividend Stabilit

SCHD Dividend Cut of -2.7% Yet Yield Holds at 3.25%: Dividend Stabilit

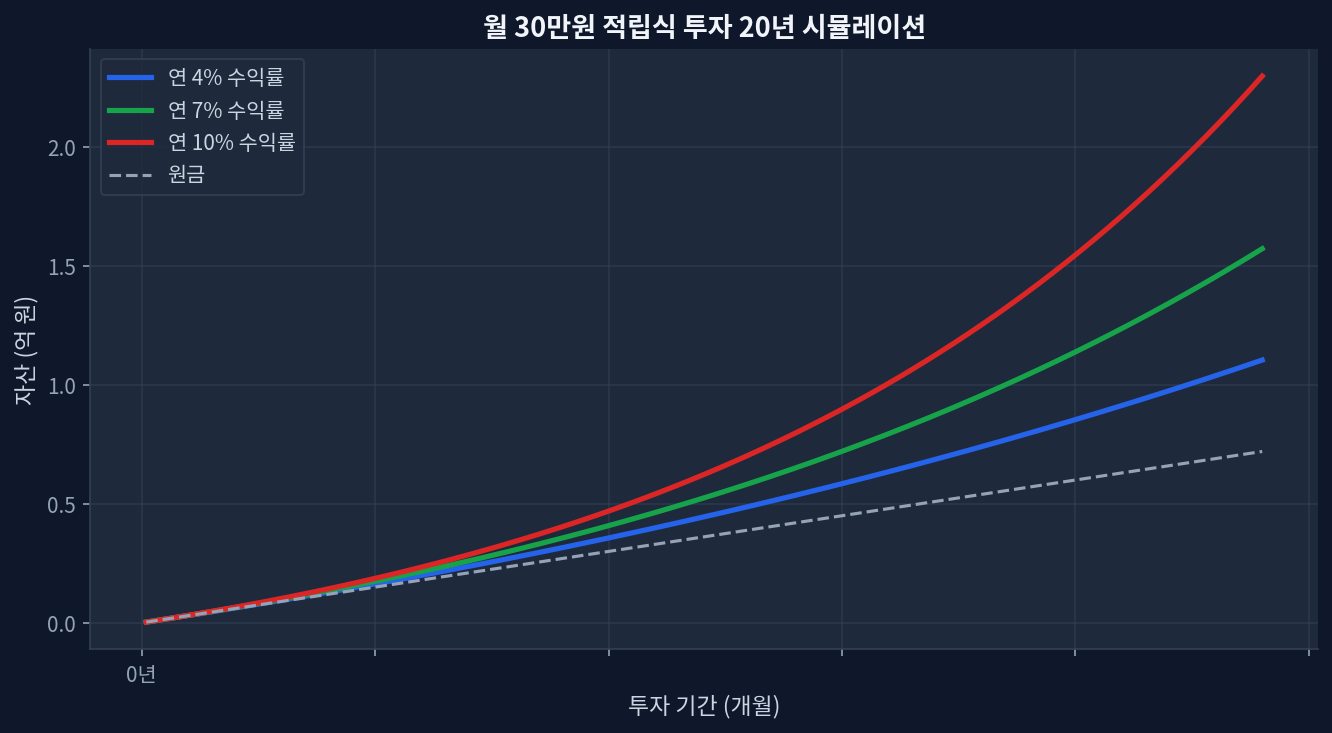
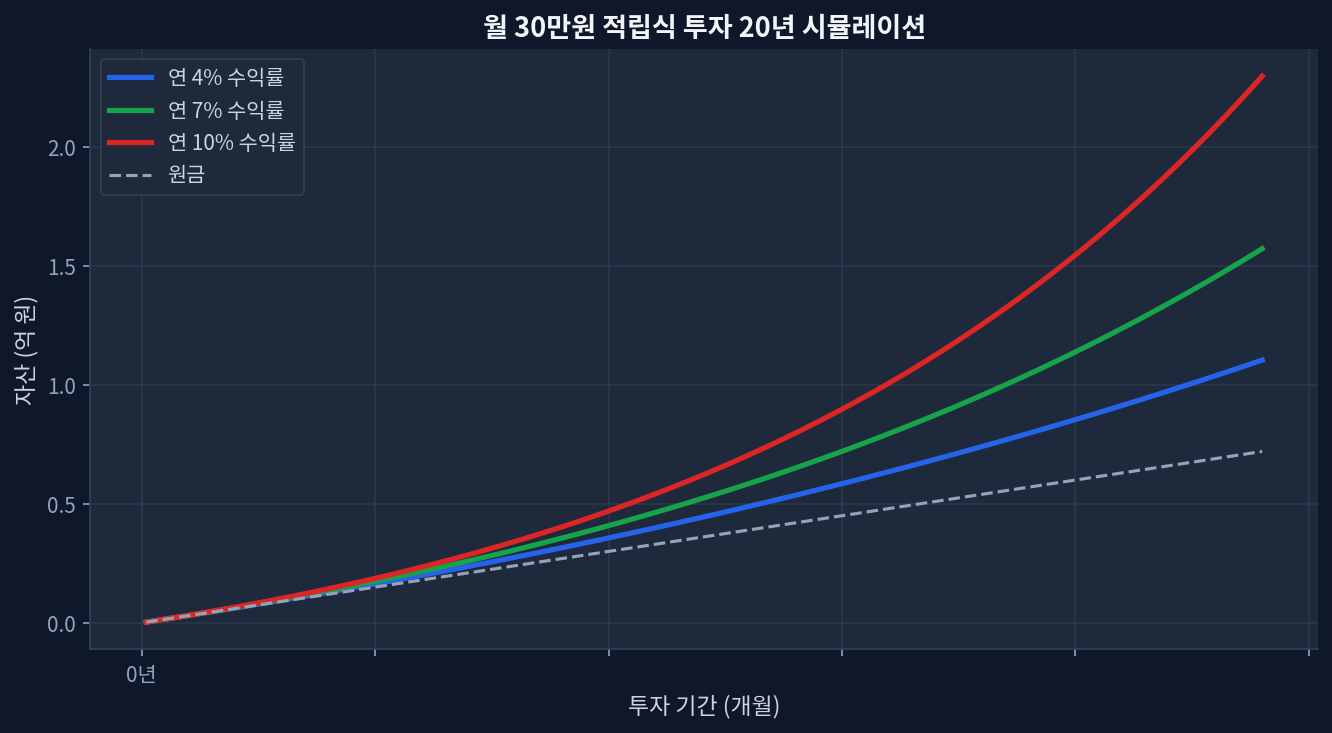
SCHD Dividend Cut of -2.7% Yet Yield Holds at 3.25%: Dividend Stability Through Market Cycles Monthly $30K investment 20-year compound growth simulation SCHD quarterly dividend: $0.2530, down 2.7% year-over-year Dividend yield: Still 3.25% — 2.2x higher than VIG's 1.47% 1-year total return: +26.5% (dividends plus capital appreciation) Current valuation: P/E 18.8, moderate level; trading near 85.7% of 52-week high Assets under management: $94.9B — scale supporting dividend stability The Dividend Cut That Does Not Signal Weakness 20-year monthly investment accumulation with dividend reinvestment Schwab US Dividend Equity ETF (SCHD) announced its quarterly dividend at $0.2530, representing a 2.7% decrease versus the same quarter in 2024 when it paid $0.2600. On its surface, this reads negative—dividends were reduced, after all. ...

June 30, 2026 · InvestIQs Research
SCHD Cuts Quarterly Dividend 2.7% Yet Holds 3.25% Yield: What the Numb

SCHD Cuts Quarterly Dividend 2.7% Yet Holds 3.25% Yield: What the Numb

SCHD quarterly dividend: $0.2530, down 2.7% year-over-year Dividend yield: 3.25% — 2.2× higher than VIG's 1.47% 1-year total return: +26.5% (dividends + price appreciation) Current valuation: P/E 18.8 (moderate), near 52-week high at 85.7% AUM: $94.9B — asset base supports dividend stability Dividend Cut, Yet No Signal of Distress Monthly $30K investment 20-year compound growth simulation Schwab US Dividend Equity ETF (SCHD) announced a quarterly dividend of $0.2530. This represents a 2.7% decline versus the same quarter in 2024, which paid $0.2600 [Schwab]. On the surface, this reads negative—a dividend reduction. ...

June 28, 2026 · InvestIQs Research
SCHD Quarterly Dividend Cut 2.7% but Yield Holds at 3.25%: Why Dividen

SCHD Quarterly Dividend Cut 2.7% but Yield Holds at 3.25%: Why Dividen

SCHD Quarterly Dividend Cut 2.7% but Yield Holds at 3.25%: Why Dividend Stability Matters More Than Headlines Monthly $30K investment 20-year compound growth simulation SCHD quarterly dividend: $0.2530, down 2.7% year-over-year Dividend yield: Still 3.25% — 2.2x higher than VIG's 1.47% 1-year total return: +26.5% (dividends plus price appreciation) Current valuation: P/E 18.8, moderate range; near 85.7% of 52-week high Assets under management: $94.9B — scale that underpins dividend stability The Dividend Cut That Does Not Look Painful Schwab US Dividend Equity ETF (SCHD) announced a quarterly dividend of $0.2530, down from $0.2600 in the same quarter of 2024—a 2.7% decrease. On the surface, this is negative news. A dividend cut is a dividend cut. ...

June 26, 2026 · InvestIQs Research
JEPI vs. SCHD: Deconstructing Covered Call Premium Costs in a 5-Year Data Review

JEPI vs. SCHD: Deconstructing Covered Call Premium Costs in a 5-Year Data Review

Over a five-year period, SCHD demonstrated a cumulative return of +47.6%, slightly exceeding JEPI's +44.3%. JEPI currently offers a significantly higher dividend yield at 8.29%, compared to SCHD's 3.29%, reflecting distinct income generation strategies. In the most recent one-year period, SCHD's return of +24.8% substantially outpaced JEPI's +8.4%, highlighting performance divergence in specific market conditions. The higher yield of JEPI is primarily derived from selling covered call options, introducing a unique premium cost dynamic not present in SCHD's traditional equity holdings. Analyzing JEPI and SCHD: A Five-Year Performance Overview Monthly $30K investment 20-year compound growth simulation Investors frequently evaluate exchange-traded funds (ETFs) like JEPI and SCHD for their distinct approaches to income and growth. A five-year review of their performance and underlying strategies reveals critical differences in total return, income generation, and risk profiles. Focusing on the period up to May 2026, both ETFs have delivered positive cumulative returns, yet their paths to achieving these outcomes vary significantly. SCHD, primarily a dividend growth fund, achieved a 5-year cumulative return of +47.6% [Yahoo Finance: SCHD]. In parallel, JEPI, which employs an equity-linked note (ELN) strategy involving covered calls, posted a 5-year cumulative return of +44.3% [Yahoo Finance: JEPI]. The proximity of these long-term figures often belies the fundamental differences in how these returns were generated. A twenty-year simulation of monthly 300,000 KRW investments at varying annual returns (4%/7%/10%) would illustrate divergent wealth accumulation paths, a critical consideration when evaluating these ETFs. ...

May 13, 2026