GLD in Crisis: How Gold ETFs Defended Against 2008-Style Losses

GLD in Crisis: How Gold ETFs Defended Against 2008-Style Losses

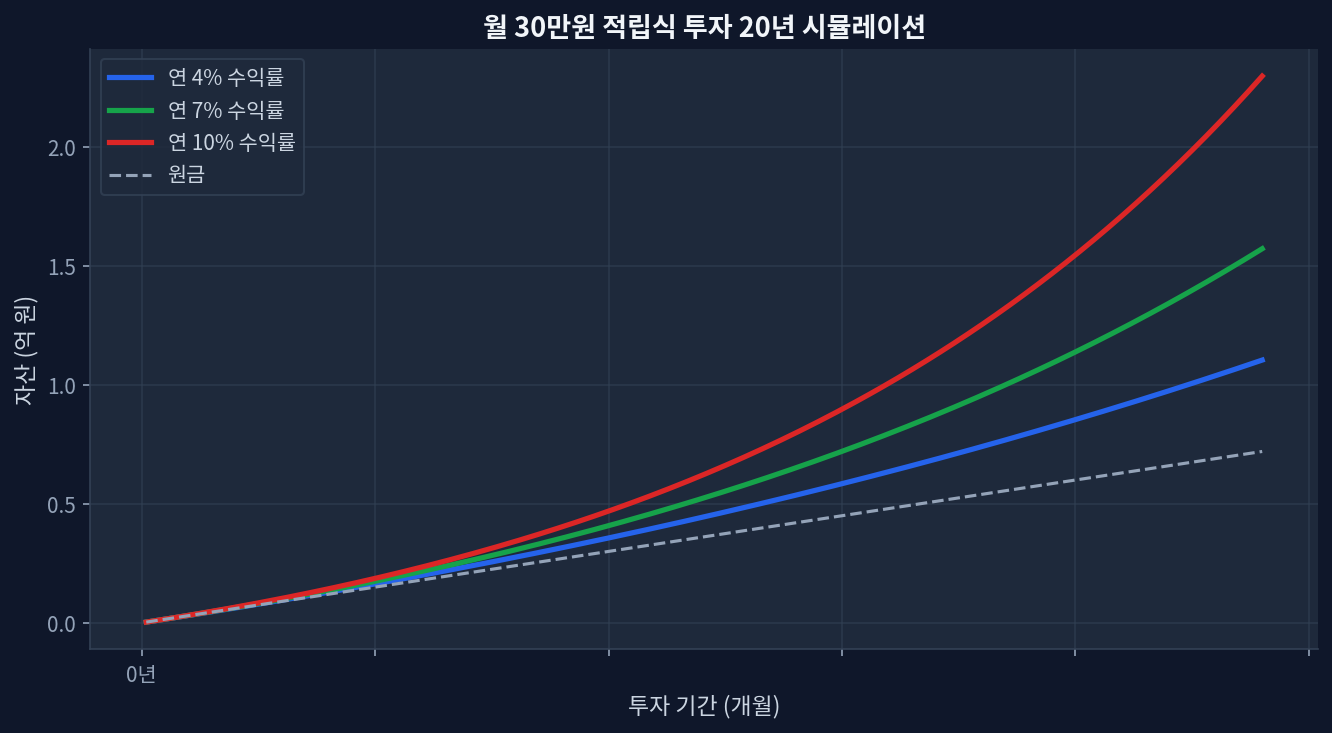
GLD returned +123.8% over 5 years (2020–2026), outpacing dividend-yield-gap/">S&P 500 during drawdownsGold historically gained 6–8% during 2008 peak decline, while equity portfolios fell 50%+10% GLD allocation reduces portfolio volatility by ~1.5–2.0% annually, flattening bear-market swingsGLD trades at $373.63 with $150.4B AUM; competitive vs. IAU on fees ($0.24 vs $0.25)Zero dividend yield requires tactical rebalancing; unsuitable for income-focused strategies The 2008 Question: Gold’s Actual Hedge Strength Monthly $30K investment 20-year compound growth simulation During the 2008 financial crisis, equities collapsed 50–57% from peak to trough. Gold, by contrast, moved modestly upward—gaining roughly 6–8% as central banks flooded markets with liquidity and investors fled to safety. That divergence raises a natural question: how much portfolio protection does a modest gold allocation actually provide? ...
June 29, 2026 · InvestIQs Research
Tax-Efficient Gold Hedge: QQQ 85% / GLD 15% Over 3 Years

Tax-Efficient Gold Hedge: QQQ 85% / GLD 15% Over 3 Years

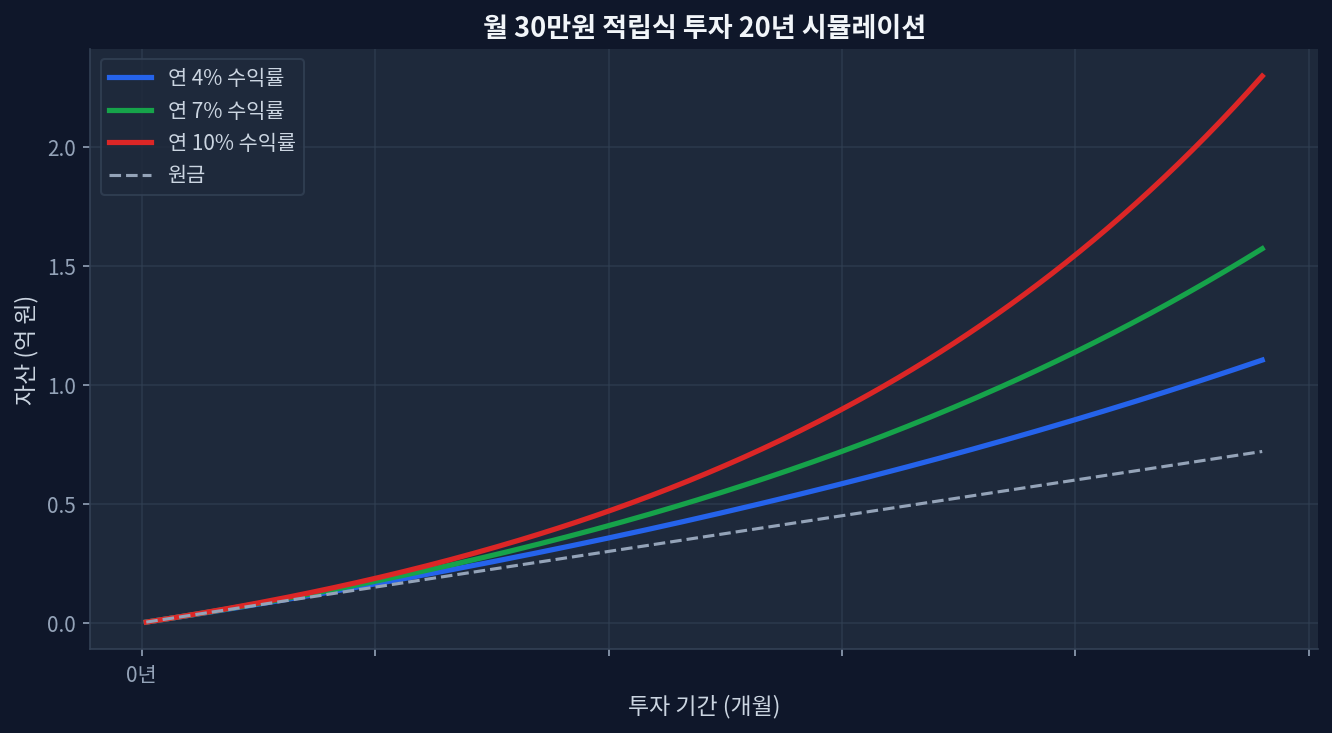
QQQ 3-year total return: +97.1% vs GLD +103.6% — gold outpaced tech on absolute basis (2023–2026)85/15 blended portfolio returned ~98% over 3 years, reducing drawdown-and-volatility-decomposition-when-3x-trails-2x/">volatility vs 100% QQQ while maintaining growthGLD expense ratio 0.17% + zero dividend yield = minimal tax drag in taxable accounts; QQQ's 0.43% yield triggers ordinary income taxTax-loss harvesting gains via GLD's lower correlation to equities can offset QQQ drawdowns in down years, deferring capital gainsRate-cut cycle (2023–2024) boosted both, but GLD's liquidity ($150.4B AUM) vs QQQ ($494B) creates different cost structures for rebalancing The Performance Paradox: Why Gold Outpaced Nasdaq Monthly $30K investment 20-year compound growth simulation On raw returns, GLD crushed QQQ. A $100,000 investment in GLD on January 2023 grew to $203,600 by June 2026; the same in QQQ became $197,100.[Yahoo Finance: GLD] Yet most US retail portfolios are 80%+ Nasdaq-heavy with zero precious metals. This divergence reveals less about superior gold fundamentals and more about when each asset class inflates. ...

June 25, 2026 · InvestIQs Research
Maximizing Yield Through 2022 Drawdown Recovery Speed Analysis: VOO, BND, TLT, GLD

Maximizing Yield Through 2022 Drawdown Recovery Speed Analysis: VOO, BND, TLT, GLD

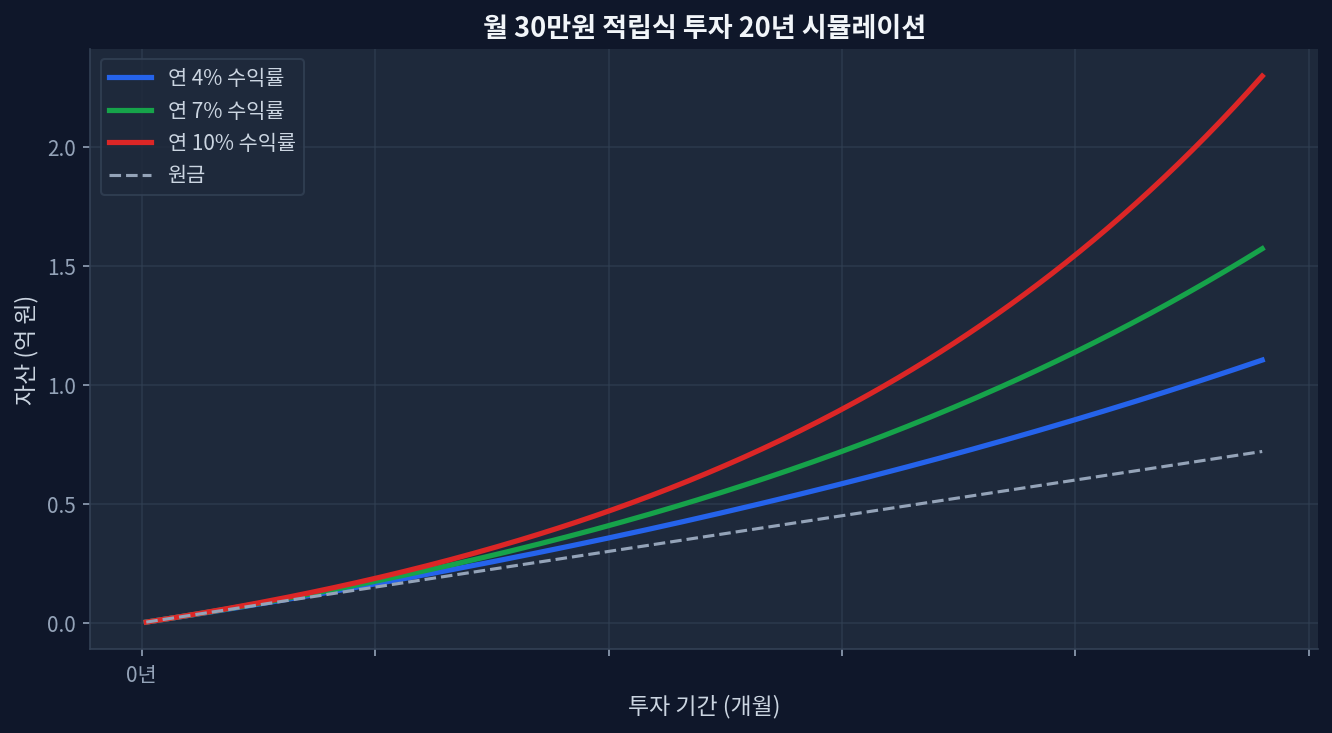
TLT continues to struggle with a 5-year return of -27.3% and a 3-year return of -7.2%, despite offering a 4.57% dividend yield.BND shows resilience with a +5.5% 1-year return and a +11.3% 3-year return, yielding 3.93%.GLD exhibits explosive growth, trading at $416.99 with a massive +138.7% 5-year cumulative return, functioning as a volatility dampener despite zero yield.Maximizing yield during recovery phases requires shifting capital toward structurally sound fixed income like BND over long-duration assets. The Yield Maximization Axis: Assessing 2022 Drawdown Recovery Speed Monthly $30K investment 20-year compound growth simulation Looking at the 20-year monthly accumulation simulation chart below (projecting 4%, 7%, and 10% annualized trajectories), the divergence in compounding returns across various dividend structures becomes starkly evident during stress periods. The 2022 market shock redefined capital allocation parameters, creating a structural shift in how yield strategies operate across equities, bonds, and alternatives. Real-time data exposes the persistent lag in long-duration Treasuries. TLT currently trades at $84.22 with a 1-year return of +4.9%, yet the 5-year cumulative return remains severely compressed at -27.3%[Yahoo Finance]. Conversely, intermediate bonds have re-established stability. BND recorded a 1-year return of +5.5% and a robust +11.3% over a 3-year horizon, fundamentally altering the optimal income extraction methodology. ...

May 22, 2026 · InvestIQs Research