Structuring a Late-Stage Retirement Portfolio: Analyzing SCHD's Dividend Efficacy for Investors in Their 50s

Structuring a Late-Stage Retirement Portfolio: Analyzing SCHD's Dividend Efficacy for Investors in Their 50s

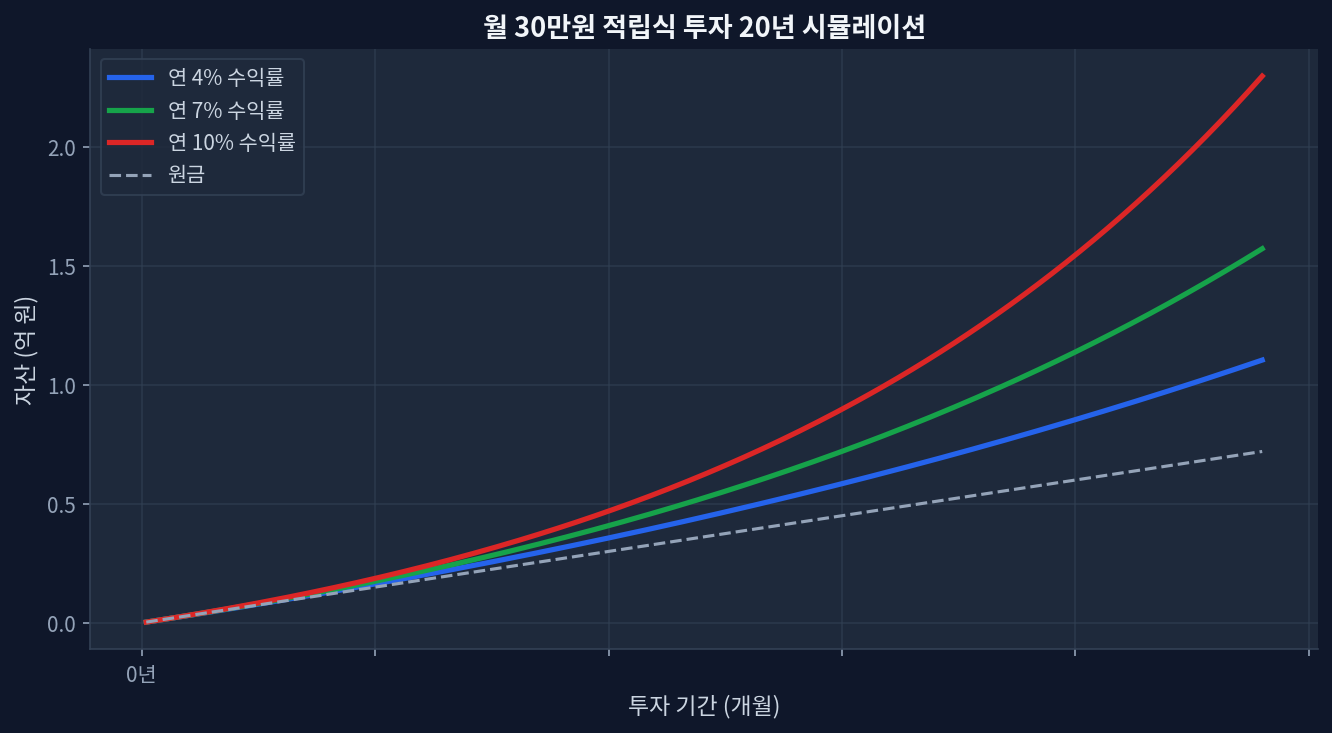
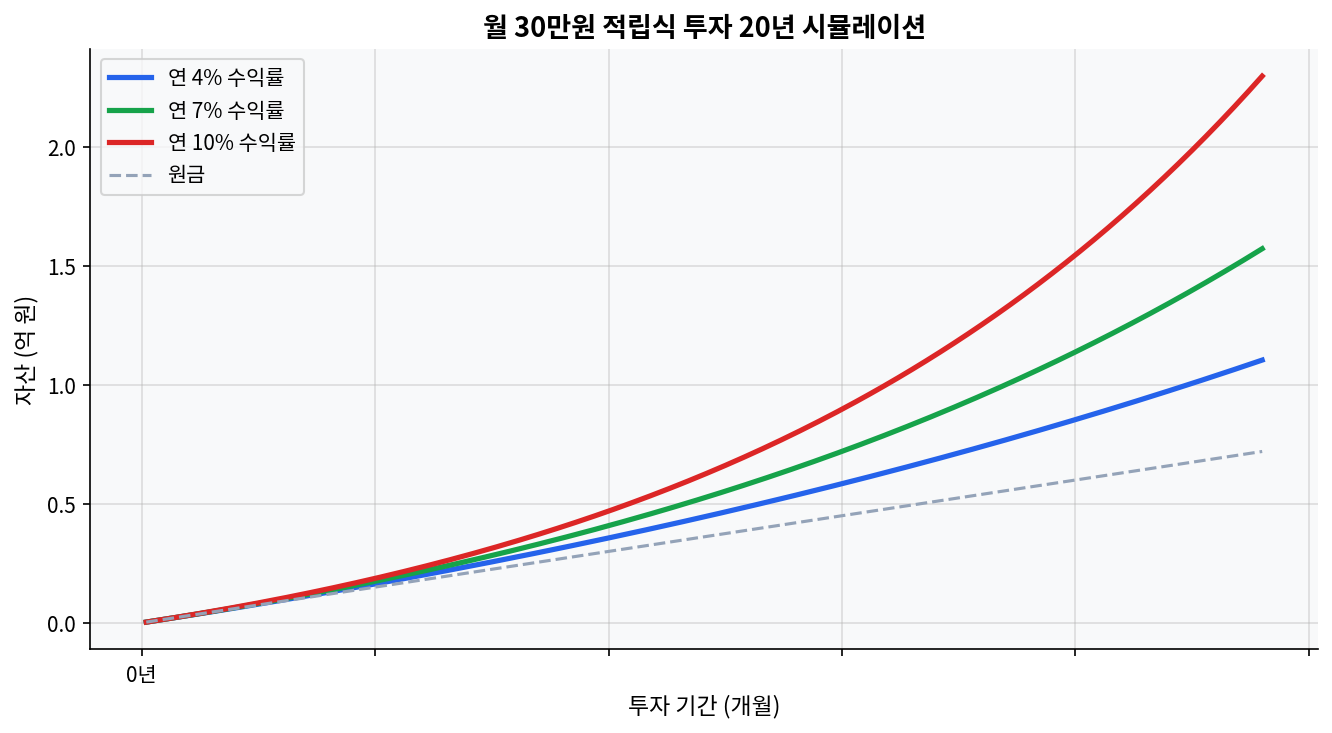
SCHD currently yields 3.21% trading at a 19.5 P/E, presenting a distinct valuation discount against VIG's 1.48% yield and 26.2 P/E. Trailing 5-year data shows VIG (+66.4%) outpacing SCHD (+53.7%), highlighting the persistent growth versus yield tradeoff in modern asset allocation. Short-term momentum favors SCHD, which posted a +31.3% 1-year return, driving the asset to 99.1% of its 52-week range ($32.83). Relying solely on historical dividend growth can lead to an incomplete risk assessment, requiring explicit modeling of market drawdowns and shifting rate environments....

May 25, 2026 · InvestIQs Research
IRA Contribution Data: Analyzing the Trade-Off Between Tax Deductions and Liquidity Risk

IRA Contribution Data: Analyzing the Trade-Off Between Tax Deductions and Liquidity Risk

Introduction: The Trade-Off Between Tax Deferral and Liquidity Constraints Monthly $30K investment 20-year compound growth simulation Taxable, Traditional IRA, and Roth IRA tax effect comparison The data indicates an 85.4% return over 5 years. This suggests compounding is maximized over the long term, but it imposes strict liquidity constraints. Beyond analyzing tax exemptions, quantifying the opportunity cost of capital through data remains necessary. IRA annual contribution limits restrict the maximum upfront tax deduction to $7,000 for standard accounts....

May 22, 2026 · InvestIQs Research
SCHD Dividend Growth Rate: 10-Year Trajectory — Separating Myth from Data

SCHD Dividend Growth Rate: 10-Year Trajectory — Separating Myth from Data

SCHD current price $31.72, dividend yield 3.29% — trading at 93.6% of 52-week range ($25.69–$32.13), effectively at multi-year highs1-year return +24.7% outpaces VIG +17.9%, but 5-year cumulative stands at SCHD +48.2% vs VIG +62.7% — a 14.5pp total-return gap favoring VIGDividend yield: SCHD 3.29% vs VIG 1.51% — a 2.2x spread, material for cash-flow-priority investorsP/E: SCHD 18.8 vs VIG 26.6 — lower valuation for SCHD reflects sector composition, not a quality discount10-year dividend growth fell to single digits after 2022 rate hikes — the "...

May 16, 2026 · InvestIQs Research
VTI vs VXUS: 15-Year Return Data and the Tax Placement Gap Most Portfolios Ignore

VTI vs VXUS: 15-Year Return Data and the Tax Placement Gap Most Portfolios Ignore

VTI 5Y return: +78.9% vs VXUS +51.1% — but VXUS leads on 1Y at +33.5% vs VTI +27.6%, a reversal worth interrogating.VXUS yields 2.69% vs VTI 1.03% — 2.6x higher income generates greater annual tax drag in taxable accounts.Valuation gap: VTI P/E 28.5 vs VXUS 18.7 — a 52% US premium, historically wide by post-2000 standards.Foreign tax credit from VXUS dividends is recoverable only in taxable brokerage accounts; permanently forfeited inside Roth IRA or 401(k)....

May 14, 2026 · InvestIQs Research
Expense Ratio Compounding: 0.03% vs 0.5% Over 30 Years

Expense Ratio Compounding: 0.03% vs 0.5% Over 30 Years

A 0.47 percentage-point fee gap means 6.97% net versus 6.50% net on a 7.00% gross-return assumption.With $1,500 invested monthly for 30 years, total contributions reach $540,000 and the projected ending balance is roughly $1.74 million at 0.03% versus $1.60 million at 0.50%.The spread is about $143,000, or roughly 8% of the lower-fee ending balance, before taxes and slippage.As of Apr. 15, 2026, VOO traded near $640.44 with a 1.11% dividend yield and a 27....

April 25, 2026
TQQQ’s 5-Year Drawdown and Volatility Breakdown: Where 3x Lagged 2x

TQQQ’s 5-Year Drawdown and Volatility Breakdown: Where 3x Lagged 2x

As of 2026-04-21, TQQQ’s five-year total return was 120.40%, with a CAGR of 16.57%.As of 2026-03-31, TQQQ’s five-year maximum drawdown was 81.65%, versus 35.12% for QQQ, or 2.33x deeper.Five-year annualized monthly volatility came in at 61.28% for TQQQ, 20.23% for QQQ, and 40.61% for QLD.Over the same five-year window, QLD outpaced TQQQ with a 137.48% total return and an 18.77% CAGR.Dividend yield was roughly 0.53% for TQQQ, 0.15% for QLD, and 0....

April 25, 2026
QQQ vs SPY 10-Year Regression: Tech Concentration vs Diversification

QQQ vs SPY 10-Year Regression: Tech Concentration vs Diversification

QQQ sits at $651.42 with a 1-year return of +44.0%, while SPY sits at $708.45 with a 1-year return of +33.8%.The 3-year cumulative gap is 30.2 percentage points: QQQ at +108.0% versus SPY at +77.8%.The 5-year cumulative gap is 15.4 percentage points: QQQ at +98.1% versus SPY at +82.7%.SPY still pays more income, with a 1.04% dividend yield versus QQQ at 0.43%, or 2.4 times as much cash yield.On an implied 5-year CAGR basis, QQQ is roughly 14....

April 24, 2026
TQQQ Five-Year Drawdown and Volatility Decomposition: When 3x Trails 2x

TQQQ Five-Year Drawdown and Volatility Decomposition: When 3x Trails 2x

As of 2026-04-21, TQQQ’s 5-year total return was 120.40%, with a CAGR of 16.57%.As of 2026-03-31, TQQQ’s 5-year maximum drawdown was 81.65%, compared with 35.12% for QQQ.5-year annualized monthly volatility was 61.28% for TQQQ, 20.23% for QQQ, and 40.61% for QLD.Over the same 5-year window, QLD outperformed TQQQ with a total return of 137.48% and a CAGR of 18.77%.Dividend yield sat at 0.53% for TQQQ, 0.15% for QLD, and 0.43% for QQQ....

April 24, 2026
VOO DCA After 12 Months: Real Returns, Mistakes, and SCHD Contrast

VOO DCA After 12 Months: Real Returns, Mistakes, and SCHD Contrast

VOO sits at $651.54 with a 1-year return of +36.3%, a 3-year cumulative return of +79.0%, a 5-year cumulative return of +85.0%, and a dividend yield of 1.09%.SCHD sits at $31.03 with a 1-year return of +26.8%, a 3-year cumulative return of +41.5%, a 5-year cumulative return of +49.8%, and a dividend yield of 3.4%.Across the provided windows, VOO beat SCHD by 9.5 percentage points over 1 year, 37.5 points over 3 years, and 35....

April 22, 2026