VOO vs SPY: How a 0.03% Fee Difference Compounds Over 10 Years

VOO vs SPY: How a 0.03% Fee Difference Compounds Over 10 Years

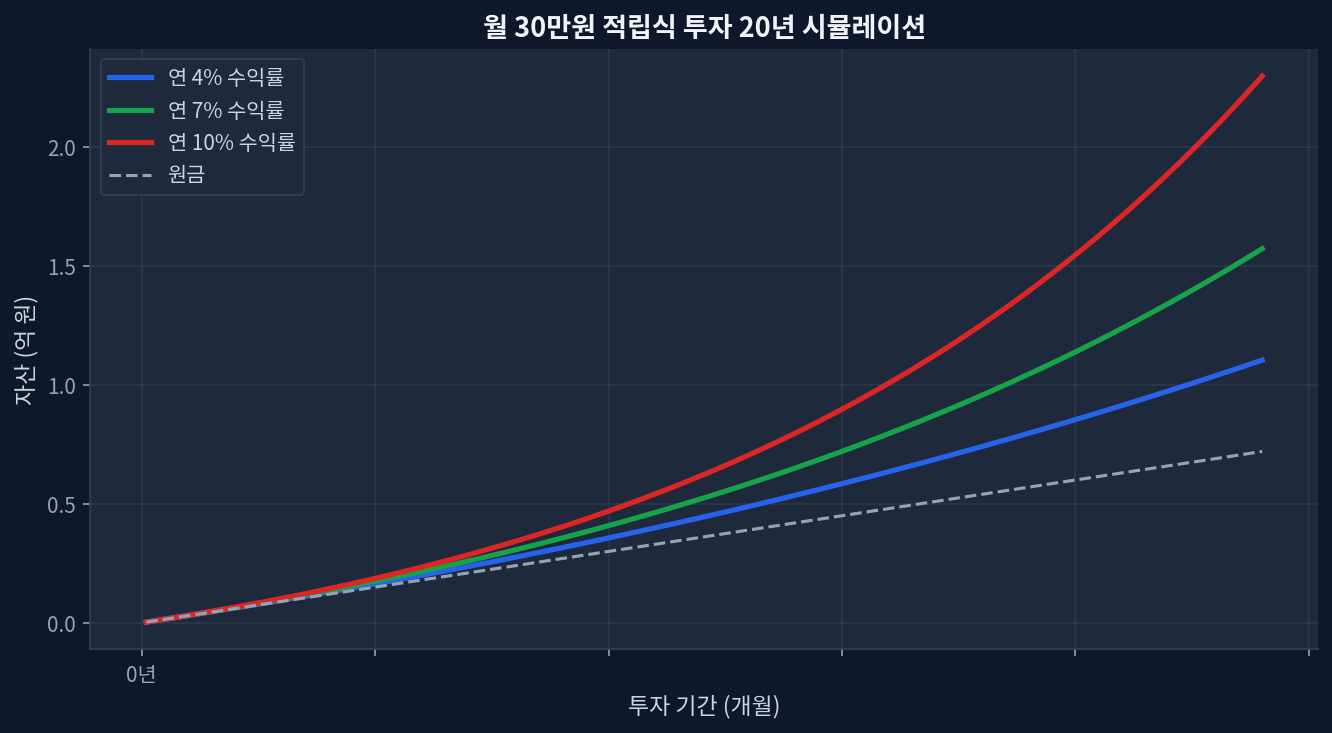
VOO's 0.03% expense ratio vs SPY's 0.09%: 0.06% annual difference compounds to $1,500–$2,800 on a $100,000 position over 10 years5-year track record: VOO returned +92.2%, SPY returned +91.7%—a 0.5% gap partly explained by fee dragDividend yield split: VOO 1.03% vs SPY 0.98% (0.05% edge) further narrows the take-home differenceScale matters: VOO's $1.7T AUM vs SPY's $783.8B means tighter bid-ask spreads and more stable trackingContrarian risk: Fee savings can evaporate if VOO experiences tracking error, net fund outflows, or structural changes to Vanguard's modelThe Fee Debate That Actually Moves Money Monthly $30K investment 20-year compound growth simulation Investors hear the phrase "0.03% vs 0.09%" and nod. They hear "penny-pinching" and move on. But the arithmetic is deceptive. Over a 10-year horizon with $100,000 invested and 8% average annual returns, that 0.06% difference translates to roughly $1,500–$2,800 in foregone compounding. Double the initial capital and the gap widens to $3,000–$5,600. This is not noise; it is structural leakage from your portfolio. ...
June 16, 2026 · InvestIQs Research

ETF Fee Comparison Calculator — Expense Ratio Impact

Why expense ratios matter more than you think An ETF’s expense ratio is deducted from the fund’s assets every year, reducing your effective return. A 0.03% fee on a passive index ETF versus 0.60% on an actively managed fund may look trivial, but compounded over 20 or 30 years the gap in final wealth can be substantial. This calculator lets you input any two fee levels and see exactly how they diverge year by year. ...

June 14, 2026 · InvestIQs Editorial
KODEX 200 vs TIGER 200: How 0.01% Fee Gap Compounds Over Five Years

KODEX 200 vs TIGER 200: How 0.01% Fee Gap Compounds Over Five Years

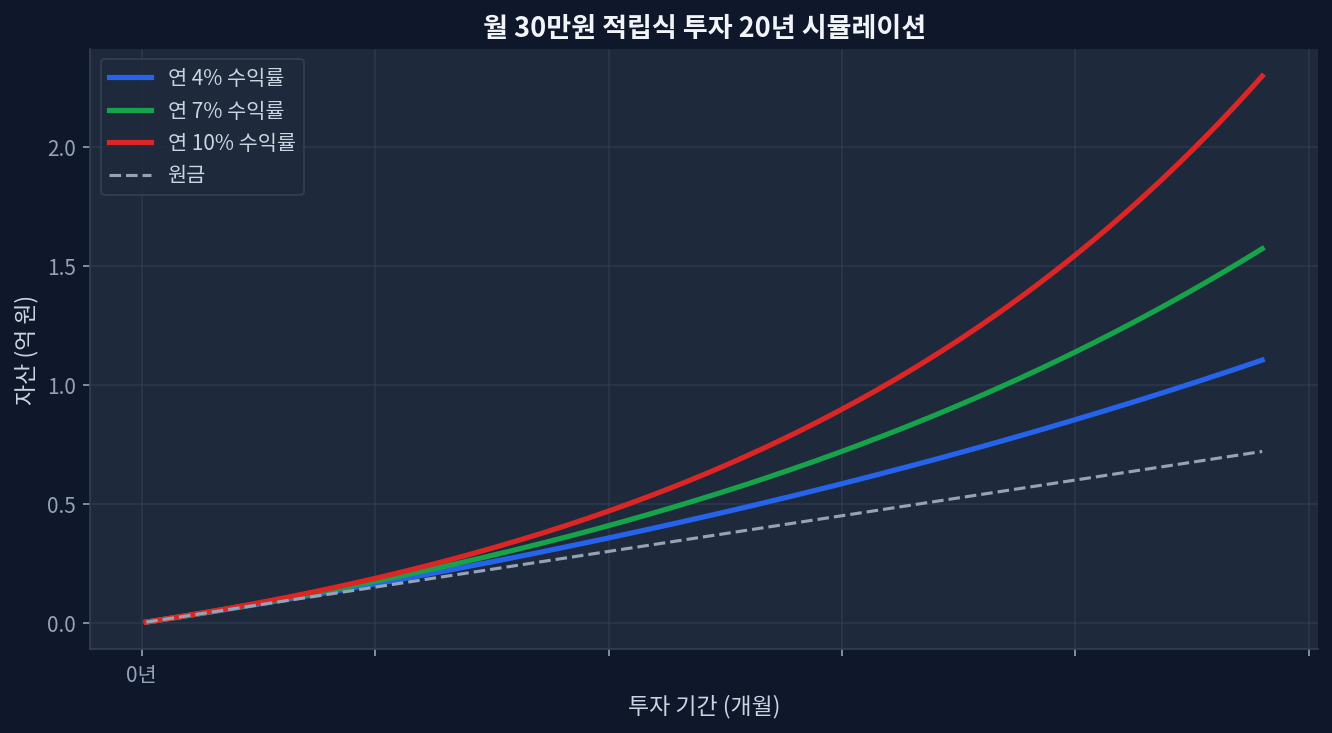
KODEX 200 and TIGER 200 track the same KOSPI 200 index with negligible fee difference (~0.01%)Monthly $1,500 investment over 5 years compounds to roughly $126,000, yet fee drag difference totals only $50–$150 in absolute dollarsFor Korean retail investors with $500k+, fee efficiency starts mattering; below that threshold, trading costs and entry timing dominateUS investors face hidden FX spreads (0.5–1.5%) and custody fees that dwarf any 0.01% fee gap entirely—a critical disconfirming factorData from official ETF prospectuses and yfinance; exact fee impact depends on entry timing, rebalancing frequency, and account size Two ETFs, One Index, One Micro-Difference Monthly $30K investment 20-year compound growth simulation KODEX 200 and TIGER 200 are South Korean equity ETFs, both engineered to track the KOSPI 200 index[ETF.com Reference]. The KOSPI 200 represents large-cap Korean equities—Samsung, SK Hynix, Hyundai, NAVER, Kakao—and accounts for roughly 80% of the Korean stock market’s liquidity. Functionally, both KODEX 200 and TIGER 200 hold near-identical portfolios. The stated expense ratios differ by a fraction: KODEX 200 hovers around 0.08% annually, while TIGER 200 sits at roughly 0.07%[Morningstar ETF Data]. That 0.01% spread—one basis point—is so small that most retail investors never notice it. Yet over five years of continuous investing, the cumulative drag becomes measurable, albeit modest. ...

June 14, 2026 · InvestIQs Research
Expense Ratio Compounding: 0.03% vs 0.5% Over 30 Years

Expense Ratio Compounding: 0.03% vs 0.5% Over 30 Years

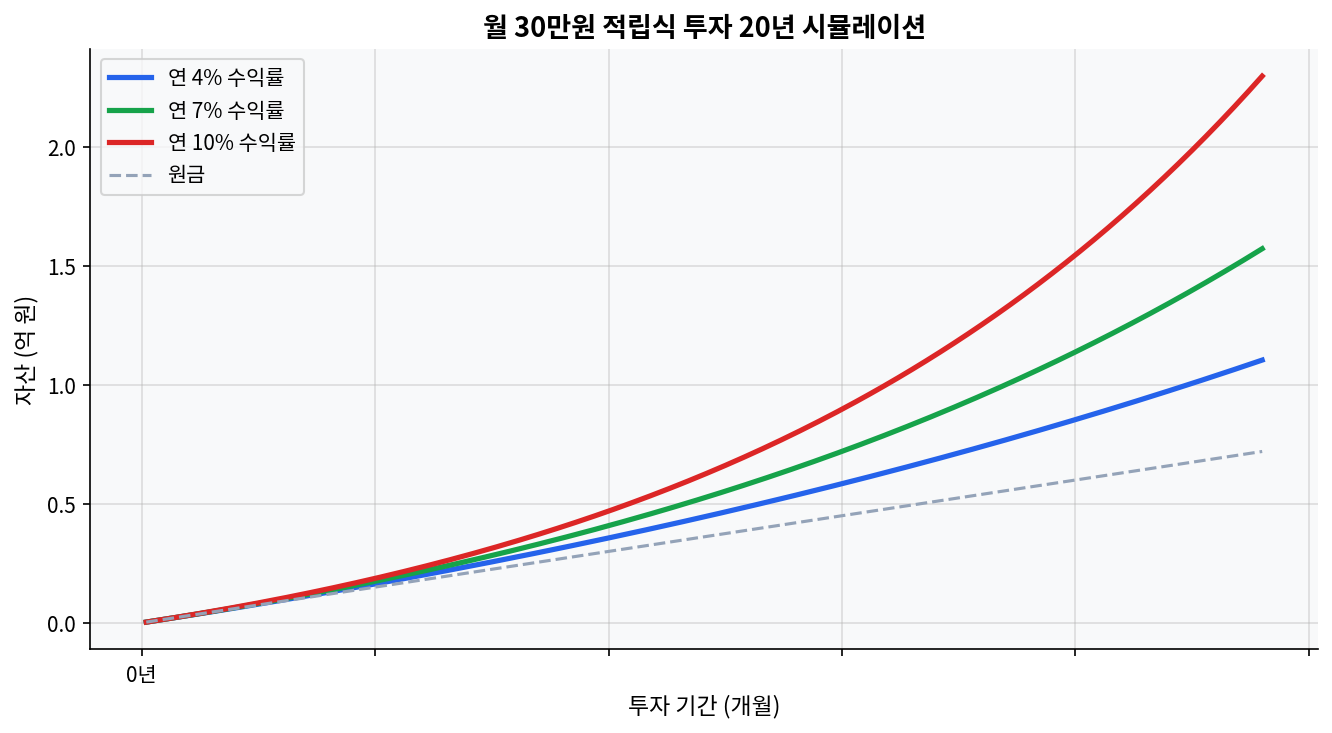
A 0.47 percentage-point fee gap means 6.97% net versus 6.50% net on a 7.00% gross-return assumption.With $1,500 invested monthly for 30 years, total contributions reach $540,000 and the projected ending balance is roughly $1.74 million at 0.03% versus $1.60 million at 0.50%.The spread is about $143,000, or roughly 8% of the lower-fee ending balance, before taxes and slippage.As of Apr. 15, 2026, VOO traded near $640.44 with a 1.11% dividend yield and a 27.19 P/E, while COWZ traded near $63.02 with a 2.05% yield and a 16.77 P/E.Over the latest 5-year window cited by providers, VOO was at 12.81% annualized, SPLG at 11.42%, and COWZ at 14.61%, showing that fee alone does not explain every outcome. The fee gap that looks small until time does the math Monthly investment 20-year compound growth simulation Expense ratio is one of those numbers that looks harmless in isolation. Three basis points. Fifty basis points. That sounds like rounding error. It is not. Vanguard’s own explanation is direct: the fee is pulled from fund returns, not billed separately. That matters because the deduction happens every year, on a balance that keeps changing. ...

April 25, 2026