2024 401(k) Contribution Limits: Tax Bracket Impact Simulation & Volatility Risks

2024 401(k) Contribution Limits: Tax Bracket Impact Simulation & Volatility Risks

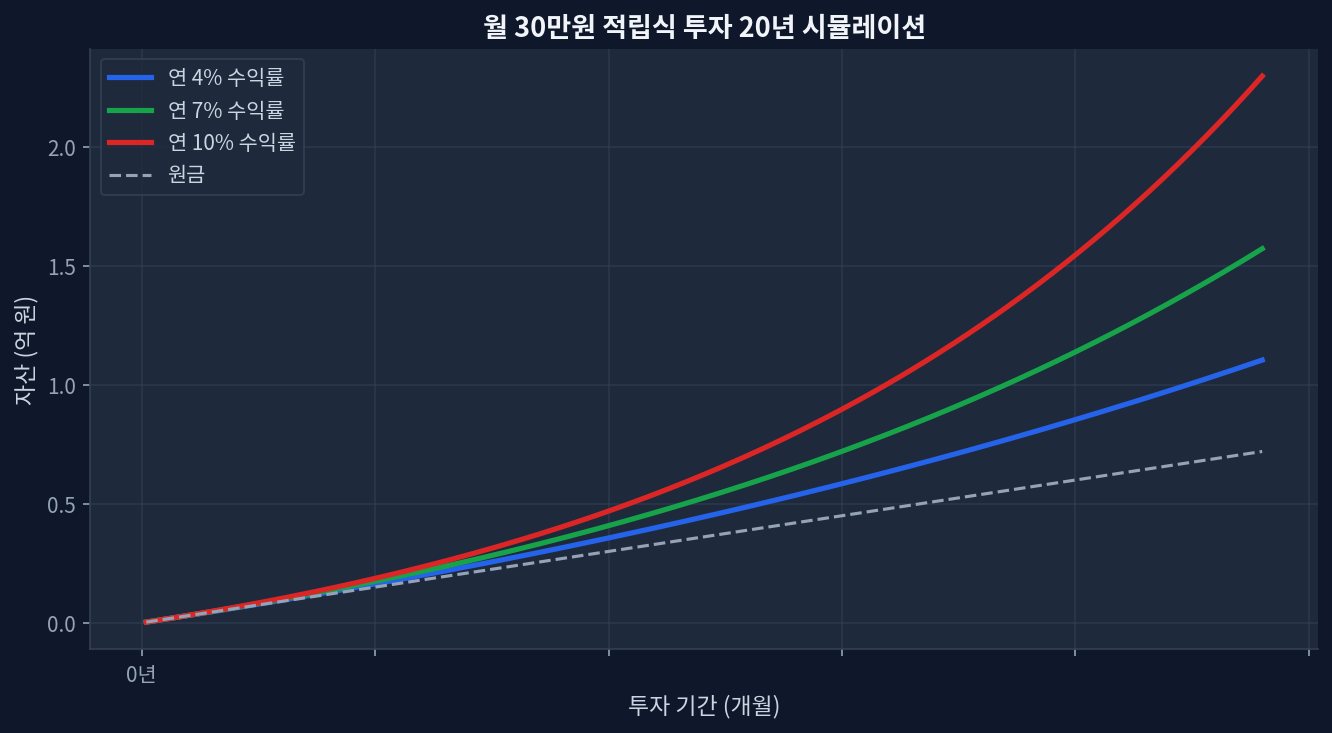
The 2024 401(k) contribution limit rose to $23,000, altering marginal tax exposure for the 24% and 32% brackets.Pre-tax contributions act as a volatility hedge against current high tax rates, deferring liability to a historically uncertain future bracket.Data indicates the 2020-2026 CAGR stood at 12.3% for major US indices, accelerating the tax cliff risk at RMD age.This diverges from the market narrative on maximizing pre-tax accounts blindly without considering post-2025 legislative tax hikes. Mapping the 2024 Limits Against Tax Volatility Monthly $30K investment 20-year compound growth simulation The 2024 IRS adjustments pushed the standard 401(k) contribution limit to $23,000. Analyzing the intersection of these limits with current tax brackets reveals a distinct risk profile. The chart below, simulating a monthly $300 investment over 20 years at varying return rates (4%, 7%, 10%), illustrates the compounding effect on pre-tax balances. ...
May 19, 2026 · InvestIQs Research
JEPI vs. SCHD: Deconstructing Covered Call Premium Costs in a 5-Year Data Review

JEPI vs. SCHD: Deconstructing Covered Call Premium Costs in a 5-Year Data Review

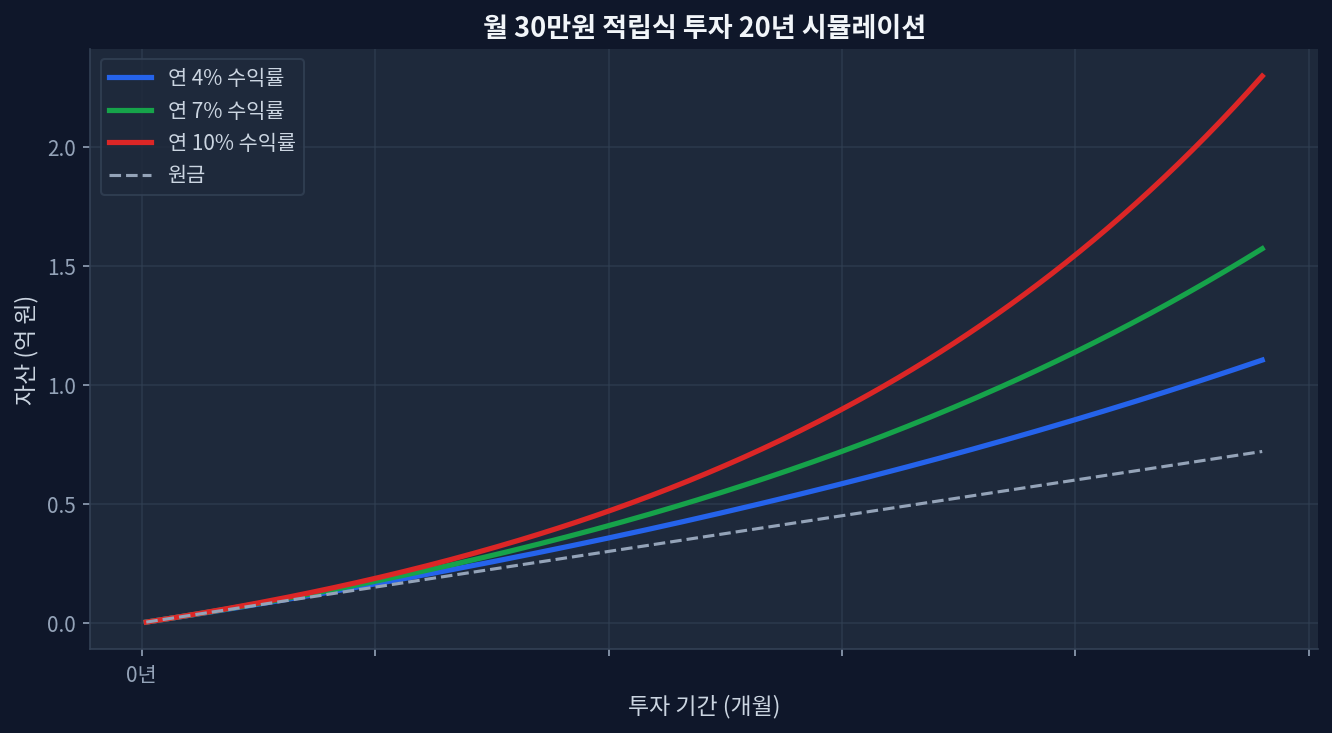
Over a five-year period, SCHD demonstrated a cumulative return of +47.6%, slightly exceeding JEPI's +44.3%. JEPI currently offers a significantly higher dividend yield at 8.29%, compared to SCHD's 3.29%, reflecting distinct income generation strategies. In the most recent one-year period, SCHD's return of +24.8% substantially outpaced JEPI's +8.4%, highlighting performance divergence in specific market conditions. The higher yield of JEPI is primarily derived from selling covered call options, introducing a unique premium cost dynamic not present in SCHD's traditional equity holdings. Analyzing JEPI and SCHD: A Five-Year Performance Overview Monthly $30K investment 20-year compound growth simulation Investors frequently evaluate exchange-traded funds (ETFs) like JEPI and SCHD for their distinct approaches to income and growth. A five-year review of their performance and underlying strategies reveals critical differences in total return, income generation, and risk profiles. Focusing on the period up to May 2026, both ETFs have delivered positive cumulative returns, yet their paths to achieving these outcomes vary significantly. SCHD, primarily a dividend growth fund, achieved a 5-year cumulative return of +47.6% [Yahoo Finance: SCHD]. In parallel, JEPI, which employs an equity-linked note (ELN) strategy involving covered calls, posted a 5-year cumulative return of +44.3% [Yahoo Finance: JEPI]. The proximity of these long-term figures often belies the fundamental differences in how these returns were generated. A twenty-year simulation of monthly 300,000 KRW investments at varying annual returns (4%/7%/10%) would illustrate divergent wealth accumulation paths, a critical consideration when evaluating these ETFs. ...

May 13, 2026