TLT's Volatility Trap: Why Rate Cuts Don't Automatically Fix Bond Losses
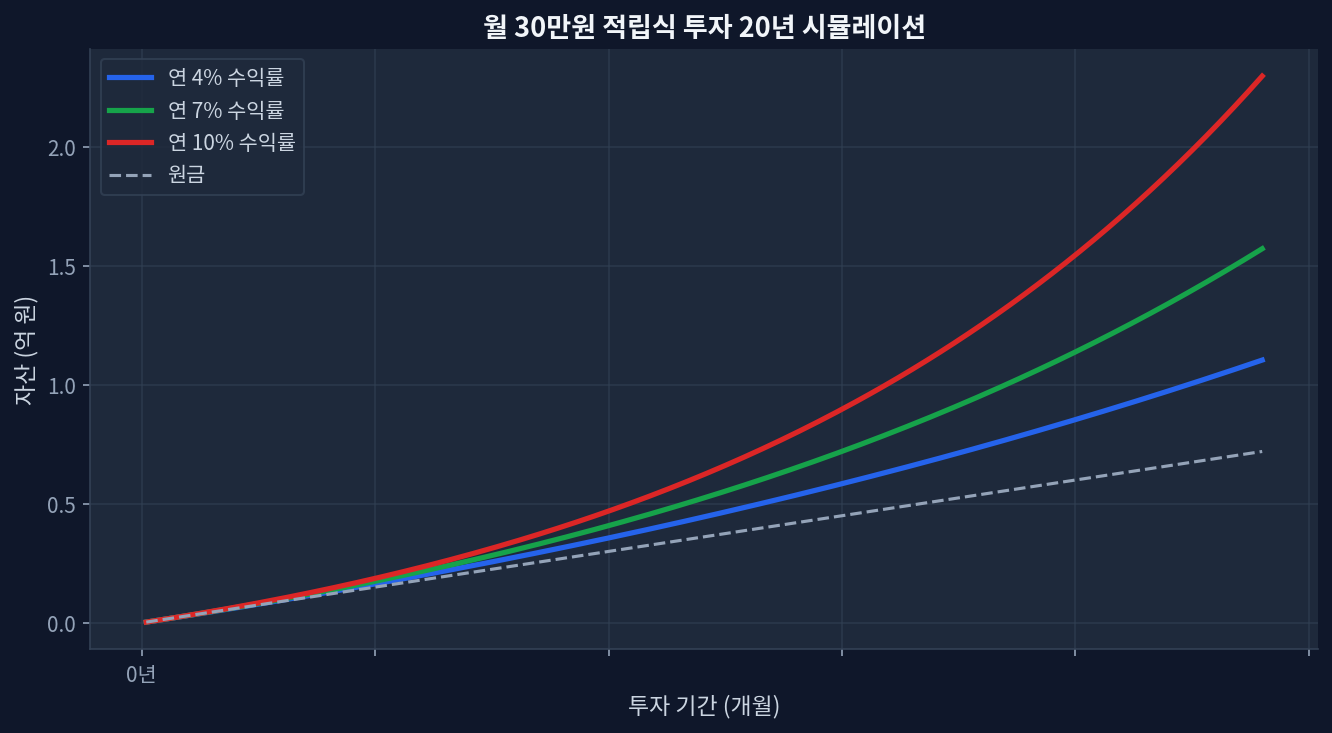
5-year drawdown: TLT down 27.8% from 2021 peak, despite conventional wisdom on duration bondsCurrent yield: 4.55% AUM-weighted, trading at $86.09 (52-week low near $82.77)The catch: A hypothetical 1% rate cut would reverse ~$4–5 per share, but volatility-decoded-why-284-loss-masks-a-15-rebound-case/">duration risk remains asymmetric—further rate hikes could erase gains fasterDollar-cost averaging reality: Monthly $1,500 allocations into TLT since 2020 experienced negative real returns despite consistent depositsDisconfirming scenario: If inflation stays sticky and the Fed pauses rate cuts, TLT holders face extended capital losses even with elevated yields The 27.8% Question: Why Long-Duration Bonds Got Decimated Monthly $30K investment 20-year compound growth simulation TLT—the iShares 20+ Year Treasury Bond ETF—has become shorthand for “bond market catastrophe” among retail investors. The numbers don’t lie. Over the past five years (2021–2026), TLT shed 27.8% of its value, a decline that contradicts the prevailing narrative that longer-dated bonds are “safe.”[yfinance] The culprit: the fastest rate-hiking cycle in 40 years. When the Federal Reserve raised the overnight rate from 0% to 5.25%–5.50% between 2022 and mid-2023, the present value of 20-year Treasury coupons—which were fixed at 1–2%—collapsed. ...