Brokerage ETF Transaction Cost Benchmark: Commission, Spread, and FX Dynamics for Diversified Portfolios
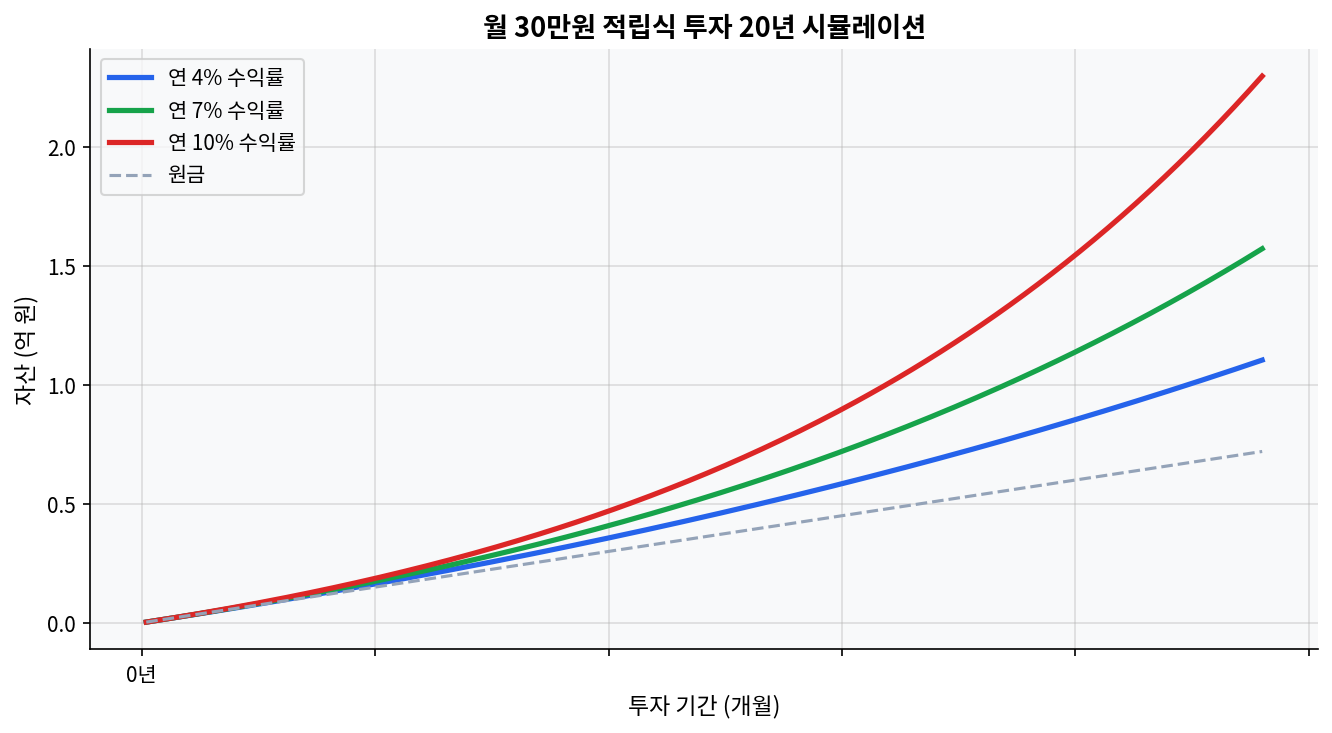
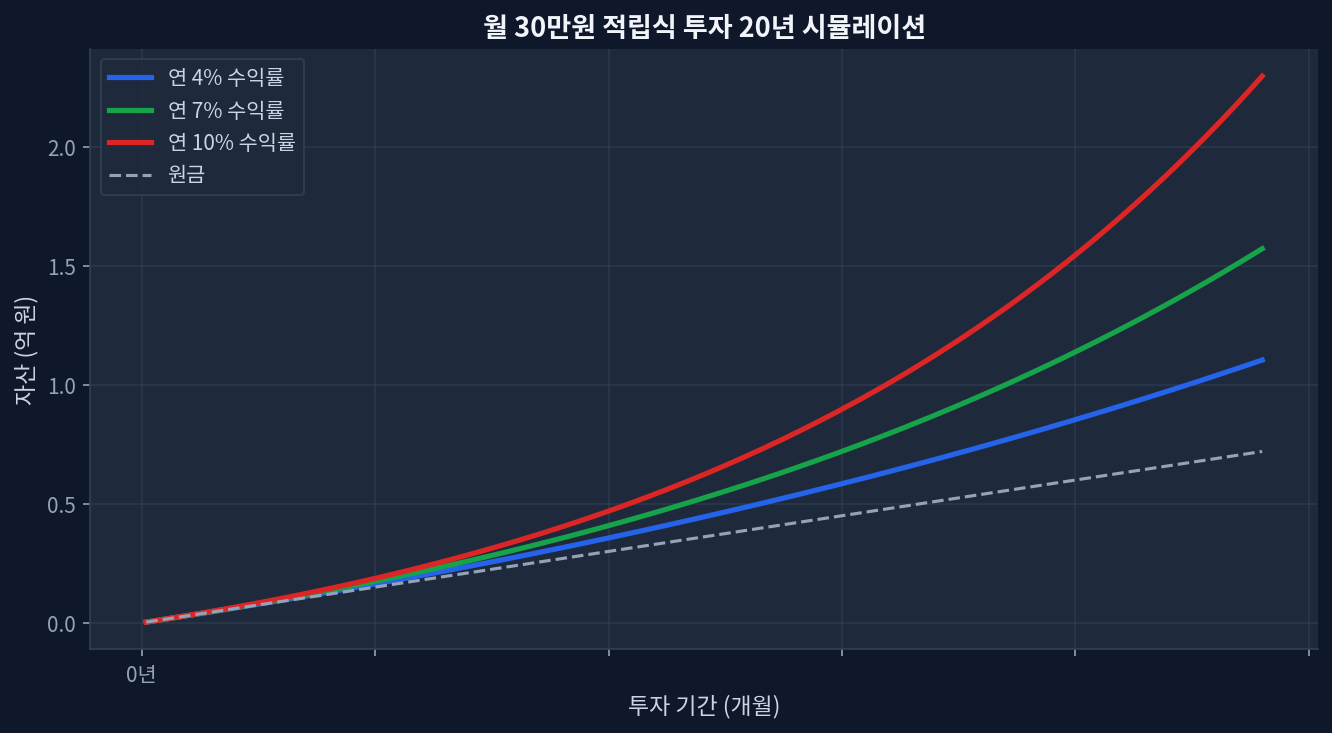
Zero-commission trades do not equate to zero-cost execution; bid-ask spreads and PFOF mechanisms generate continuous hidden friction.For globally diversified portfolios, FX conversion spreads often exceed the total ETF expense ratios, demanding optimized currency strategies.During the 2020 volatility shock, bond ETF spreads widened by up to 400%, penalizing reactive portfolio reallocation.Portfolio diversification efficiency remains heavily dependent on execution timing and institutional-grade brokerage routing logic. Unveiling the True Costs of Portfolio Diversification Monthly $30K investment 20-year compound growth simulation Looking at the chart below, the 5-year growth of +85% is particularly impressive. However, achieving these theoretical returns within a broadly diversified portfolio requires navigating structural friction points that retail brokerages often obscure. ...