JEPI's 10.3% Dividend Hike Masks Troubling Total Return Gap vs. SCHD

JEPI's 10.3% Dividend Hike Masks Troubling Total Return Gap vs. SCHD

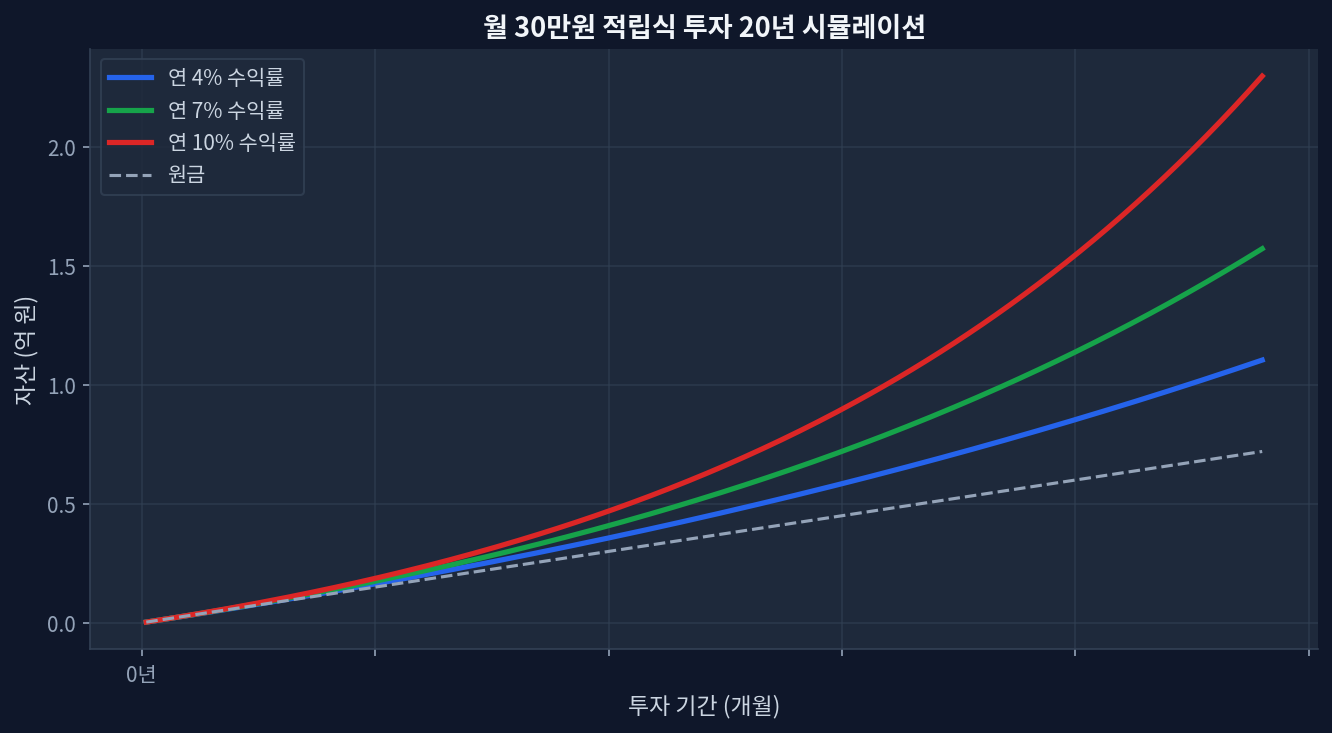
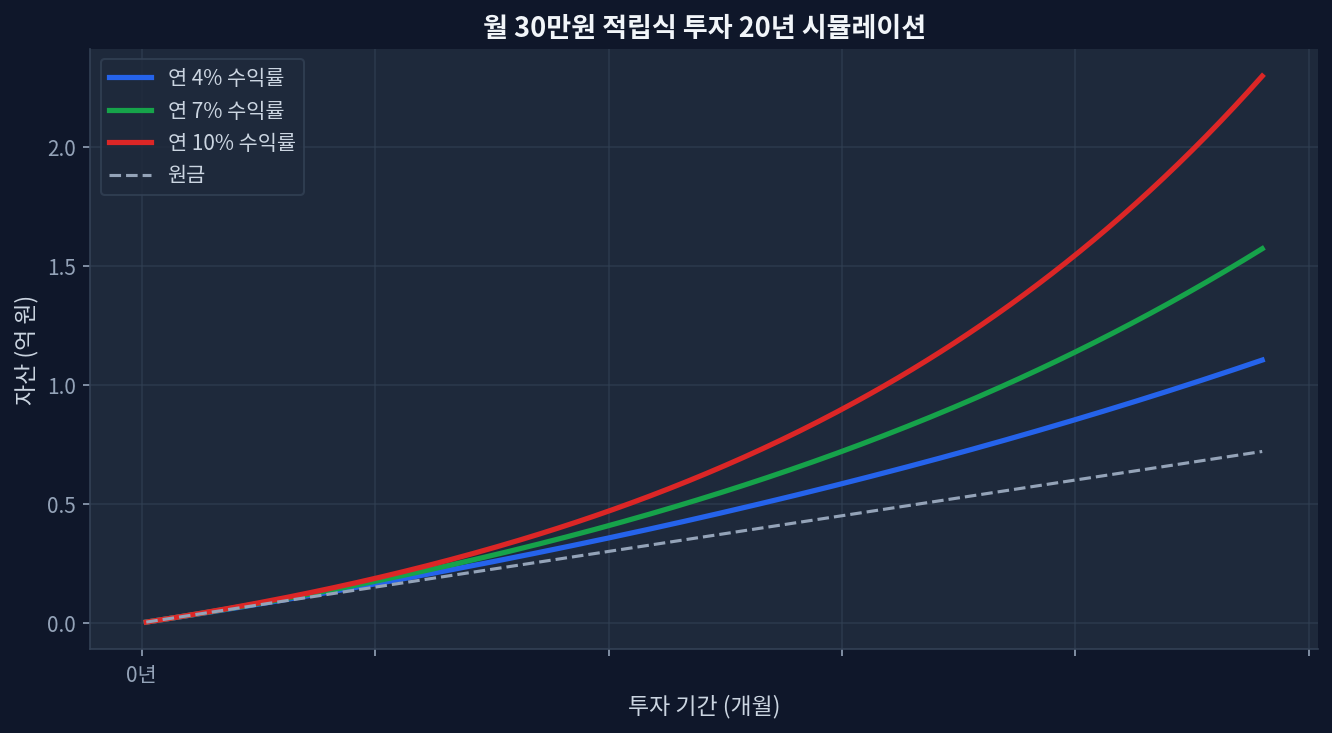
JEPI quarterly dividend raised to $0.3870 (up 10.3% year-over-year)Current dividend yield: 8.08% (elevated) vs 1-year total return: +7.4% (weak)5-year cumulative return: +42.5% vs SCHD +54.9% (2.4%p annual underperformance)P/E ratio 26.8 (SCHD 19.0) represents 40% valuation premium; trading at 30.2% of 52-week range (multi-year low)Cash extraction pressure: elevated dividend payouts compress capital preservation capacity, weakening price support The Structural Dilemma Behind the Dividend Raise Monthly $30K investment 20-year compound growth simulation 20-year monthly investment simulation showing dividend and capital gain divergence JEPI’s quarterly dividend increase to $0.3870—a 10.3% rise from the prior-year $0.3508—presents as a positive signal on the surface. Yet for a $44.7 billion ETF to merit attention primarily for a dividend raise already signals a deeper issue. ...
July 20, 2026 · InvestIQs Research
JEPI Quarterly Dividend Raised 10.3%, Yet Growth Stagnation Signals Ca

JEPI Quarterly Dividend Raised 10.3%, Yet Growth Stagnation Signals Ca

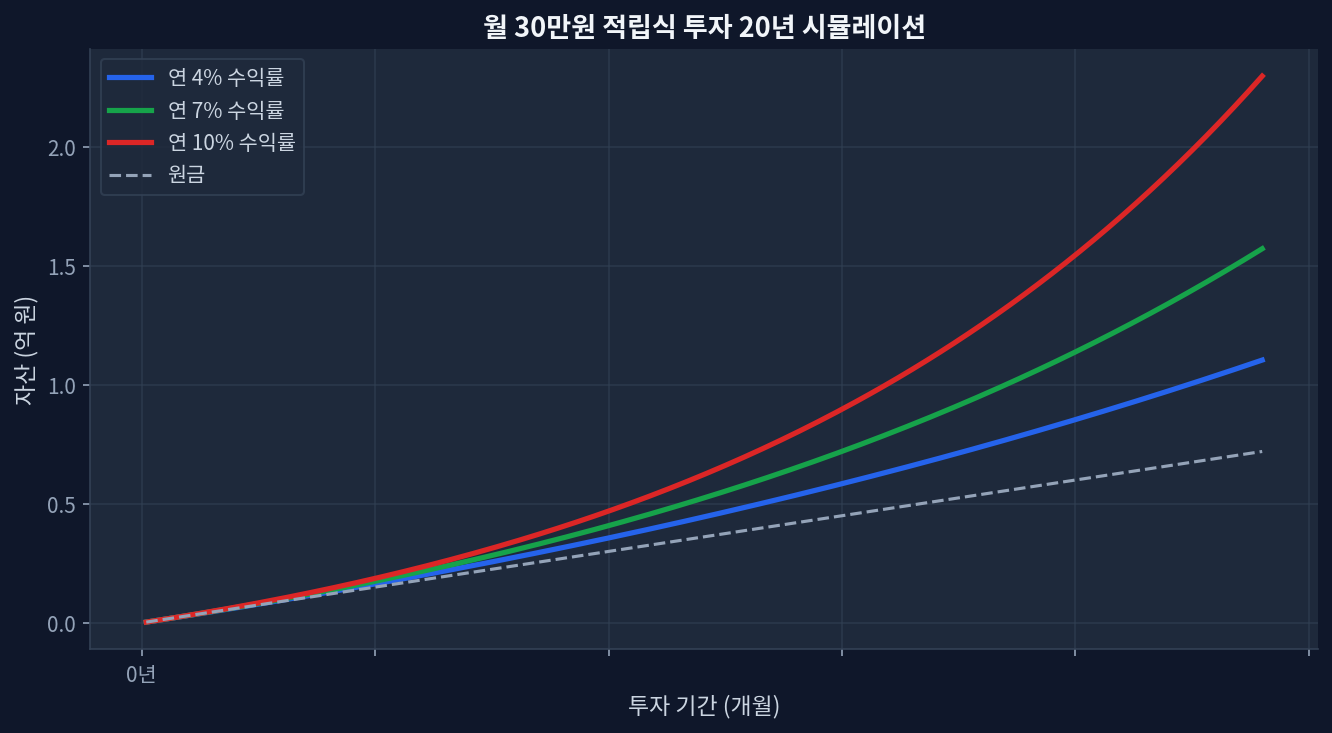
schd-deconstructing-covered-call-premium-costs-in-a-5-year-data-review/">JEPI quarterly dividend announcement: $0.3870 (+10.3% year-over-year increase)Current dividend yield: 8.08% (elevated) vs. 1-year total return: +7.4% (weak)5-year cumulative return: +42.5% vs. SCHD +54.9% (2.4% annualized gap)P/E ratio 26.8 (40% premium to SCHD's 19.0); trading at 30.2% of 52-week range (bearish signal)Cash outflow pressure: elevated dividend payments reduce retained capital, weakening share price defense The Structural Dilemma Hidden in Dividend Growth Monthly $30K investment 20-year compound growth simulation Monthly $2,000 Recurring Investment Over 20 Years: Compound Growth Simulation JEPI’s quarterly dividend increase to $0.3870 appears favorable on the surface. A 10.3% jump from the prior-year quarter’s $0.3508 demonstrates consistency. Yet for a $44.7 billion ETF to draw attention primarily on dividend growth itself represents a structural problem. ...

July 19, 2026 · InvestIQs Research
SCHD Quarterly Dividend Cut 2.7%, Yet 3.25% Yield Persists: Why the Ma

SCHD Quarterly Dividend Cut 2.7%, Yet 3.25% Yield Persists: Why the Ma

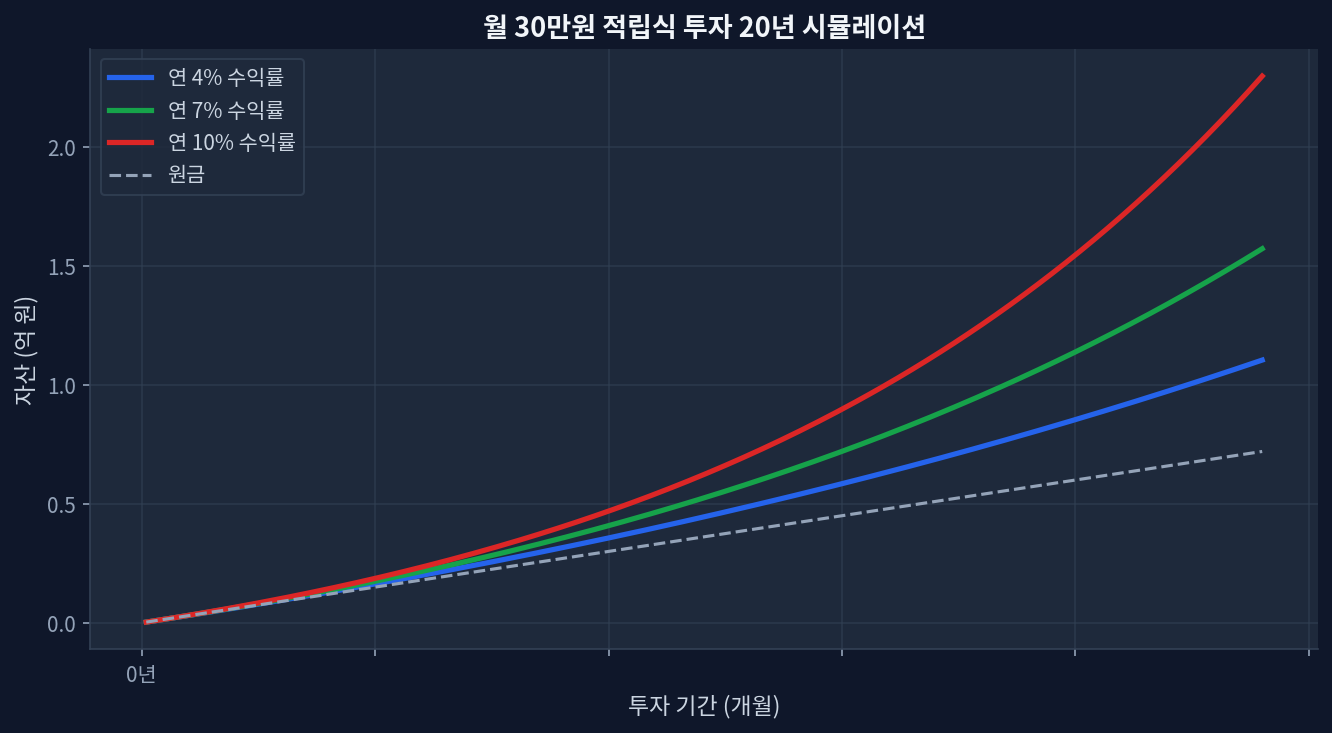
SCHD Quarterly Dividend Cut 2.7%, Yet 3.25% Yield Persists: Why the Market Narrative Misses the Point Monthly $30K investment 20-year compound growth simulation SCHD quarterly dividend: $0.2530, down 2.7% year-over-year Dividend yield: Still 3.25% — 2.2x higher than VIG at 1.47% One-year total return: +26.5% (dividend plus capital appreciation) Current valuation: P/E 18.8, moderate territory, currently trading 85.7% into the 52-week range Assets under management: $94.9B — scale that underpins distribution stability Dividend Cut, Yet Surprisingly Resilient Schwab US Dividend Equity ETF (SCHD) announced a quarterly distribution of $0.2530—down 2.7% from the same period last year at $0.2600. On the surface, a contraction in cash flow. Dividend was trimmed, so the narrative should be negative. ...

July 1, 2026 · InvestIQs Research
VOO vs SCHD: Which ETF Wins Under a 15% Capital-Gains Tax Regime?

VOO vs SCHD: Which ETF Wins Under a 15% Capital-Gains Tax Regime?

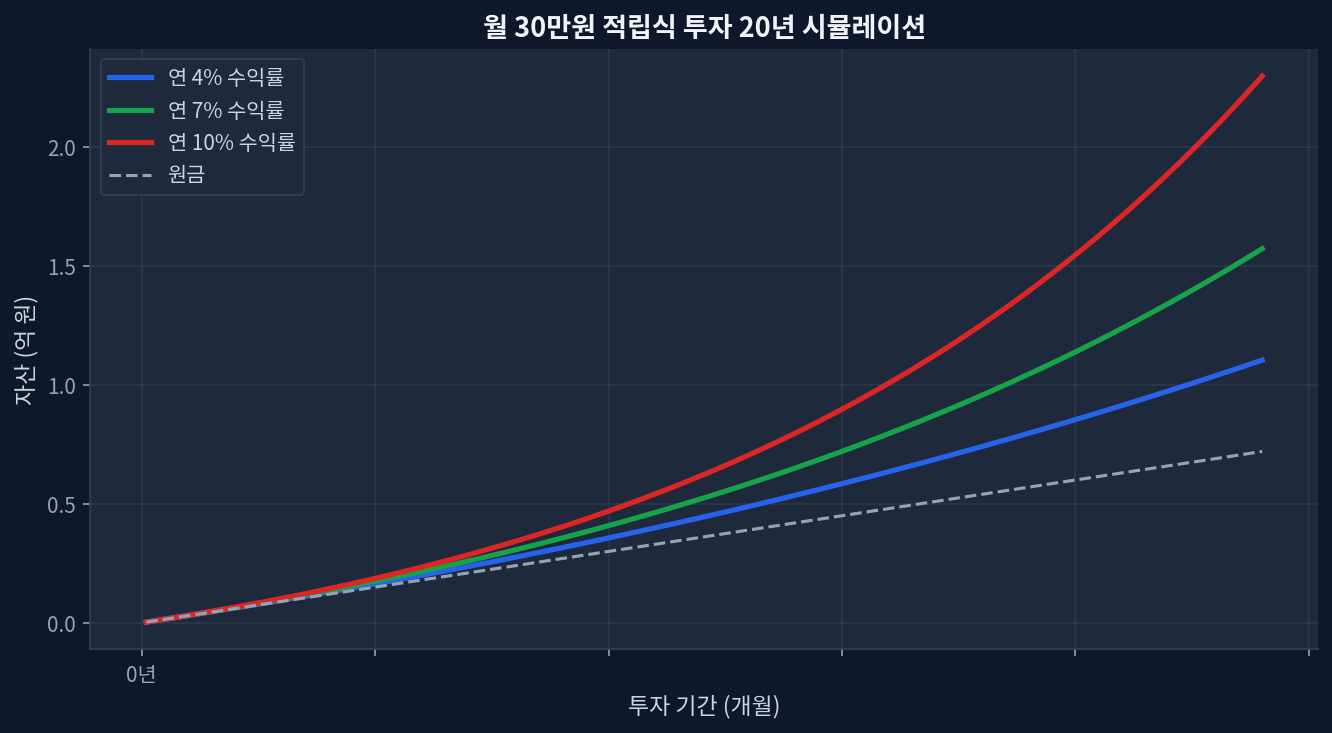
VOO delivered +26.8% return YTD with 1.03% yield; compounding-beats-2m-krw-in-annual-savings/">SCHD posted +24.2% with 3.25% yield 5-year divergence: VOO +89.0% vs SCHD +48.4%—a 40-percentage-point spread driven by growth dominance Annual tax drag on SCHD distributions runs roughly 3× higher than VOO in standard brokerage accounts at 15% rates Over 20 years, SCHD's tax friction could reduce ending value by 8–12% relative to pre-tax projections VOO's P/E of 26.9 vs SCHD's 18.8 signals growth premium; contrarian case favors SCHD if rates compress Two Philosophies, One Tax Problem Monthly $30K investment 20-year compound growth simulation VOO, the Vanguard S&P 500 ETF, tracks all 500 large-cap stocks with an expense ratio of 0.03% and minimal annual distributions (1.03% yield). SCHD, Schwab U.S. Dividend Equity ETF, targets dividend-growth stocks at 0.06% expense and generates 3.25% annual income. Performance over the past year shows VOO ahead: +26.8% versus SCHD’s +24.2%. Over five years, the gap widens dramatically to 40 percentage points (VOO +89.0%, SCHD +48.4%)[Yahoo Finance]. ...

June 20, 2026 · InvestIQs Research
The Hidden Cost of 3x Leverage: QQQ vs TQQQ in a -30% Crash

The Hidden Cost of 3x Leverage: QQQ vs TQQQ in a -30% Crash

The Hidden Cost of 3x Leverage: QQQ vs [drawdown](/en/study/tqqq-five-year-<a href=)-and-volatility-decomposition-when-3x-trails-2x/">TQQQ in a -30% Crash QQQ delivered +40.7% over the past 12 months but now sits 96.4% within its 52-week range — near the top TQQQ's 3x leverage amplifies both gains and losses; in a -30% Nasdaq downturn, QQQ holders face -30% drawdown while TQQQ could lose -80% or more due to rebalancing drag Daily rebalancing in TQQQ introduces a "volatility tax" that erodes long-term returns, especially in sideways markets QQQ's P/E ratio of 34.0 reflects elevated valuation; TQQQ compounds this risk with leverage Scenario data shows a tech worker investing $1,500 monthly since 2020 faces asymmetric downside with leverage — protection requires hedging or cash reserves The Nasdaq has roared higher for most of 2024 and into 2025, with QQQ gains posting +40.7% over the past year. Yet that return masks an uncomfortable truth: the index now trades at a P/E ratio of 34.0, sits at 96.4% of its 52-week high, and leaves little room for error. For those tempted by the allure of leverage, the promise of 3x returns via TQQQ feels irresistible. But leverage works both ways, and the math of a -30% correction reveals why many leverage-chasing investors end up with catastrophic losses. ...

June 19, 2026 · InvestIQs Research
VOO vs SPY: How a 0.03% Fee Difference Compounds Over 10 Years

VOO vs SPY: How a 0.03% Fee Difference Compounds Over 10 Years

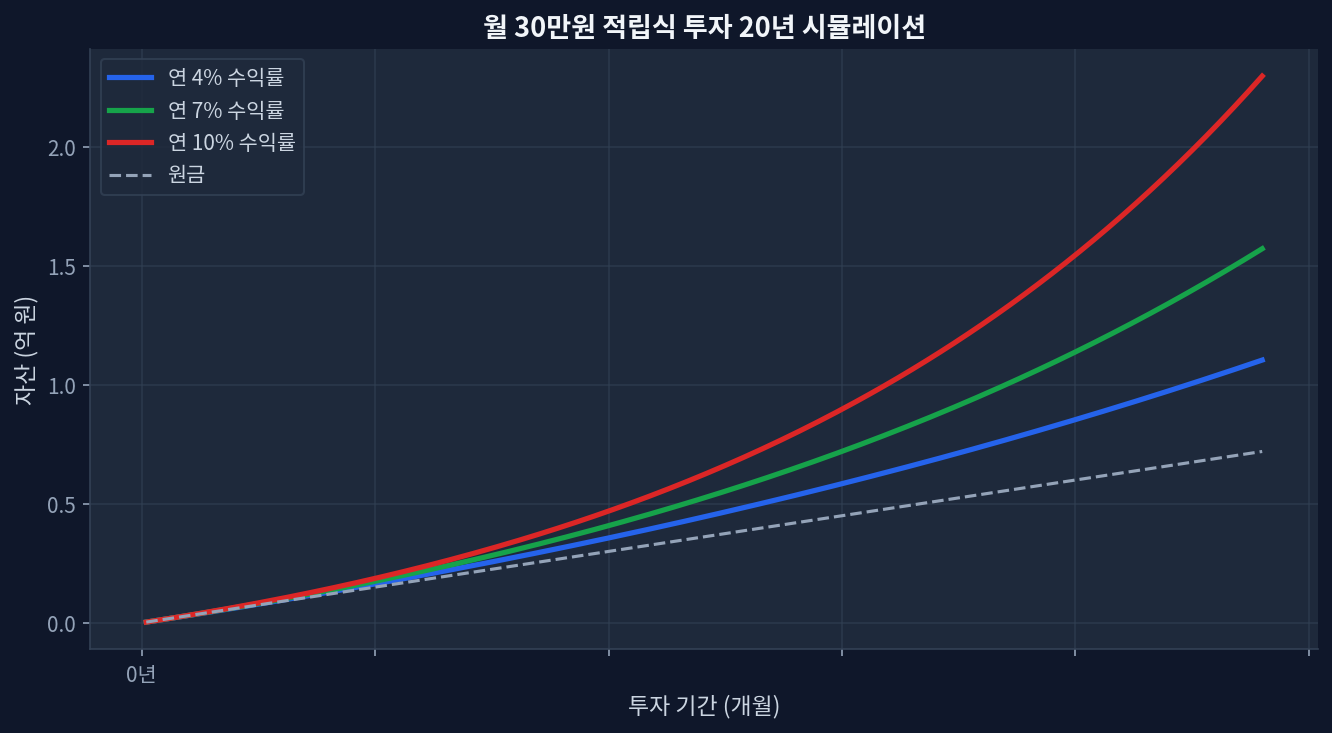
VOO's 0.03% expense ratio vs SPY's 0.09%: 0.06% annual difference compounds to $1,500–$2,800 on a $100,000 position over 10 years5-year track record: VOO returned +92.2%, SPY returned +91.7%—a 0.5% gap partly explained by fee dragDividend yield split: VOO 1.03% vs SPY 0.98% (0.05% edge) further narrows the take-home differenceScale matters: VOO's $1.7T AUM vs SPY's $783.8B means tighter bid-ask spreads and more stable trackingContrarian risk: Fee savings can evaporate if VOO experiences tracking error, net fund outflows, or structural changes to Vanguard's modelThe Fee Debate That Actually Moves Money Monthly $30K investment 20-year compound growth simulation Investors hear the phrase "0.03% vs 0.09%" and nod. They hear "penny-pinching" and move on. But the arithmetic is deceptive. Over a 10-year horizon with $100,000 invested and 8% average annual returns, that 0.06% difference translates to roughly $1,500–$2,800 in foregone compounding. Double the initial capital and the gap widens to $3,000–$5,600. This is not noise; it is structural leakage from your portfolio. ...

June 16, 2026 · InvestIQs Research

JEPI vs JEPQ — ETF Comparison

JEPI vs JEPQ: Key Differences JEPI and JEPQ share the same JPMorgan equity-premium-income strategy but differ in their equity base. JEPI uses a low-volatility U.S. stock portfolio; JEPQ applies the same overlay to Nasdaq-100-style holdings. ...

June 14, 2026 · InvestIQs Editorial

QYLD vs JEPQ — ETF Comparison

QYLD vs JEPQ: Key Differences Both QYLD and JEPQ are Nasdaq-linked covered-call funds, but with different coverage ratios. QYLD sells calls on 100% of its index exposure; JEPQ uses a selective options overlay that preserves more upside. ...

June 14, 2026 · InvestIQs Editorial

SCHD vs JEPI — ETF Comparison

SCHD vs JEPI: Key Differences SCHD and JEPI represent two distinct income approaches. SCHD pursues dividend growth through equity ownership; JEPI supplements equity income with an options overlay to deliver a higher monthly distribution. ...

June 14, 2026 · InvestIQs Editorial

SCHD vs VOO — ETF Comparison

SCHD vs VOO: Key Differences SCHD and VOO represent income versus total-return orientations within U.S. large-cap equities. SCHD focuses on dividend-paying quality companies; VOO tracks the full S&P 500 with a much smaller yield but broader market coverage. ...

June 14, 2026 · InvestIQs Editorial