TLT Volatility Decoded: Why -28.4% Loss Masks a 15% Rebound Case
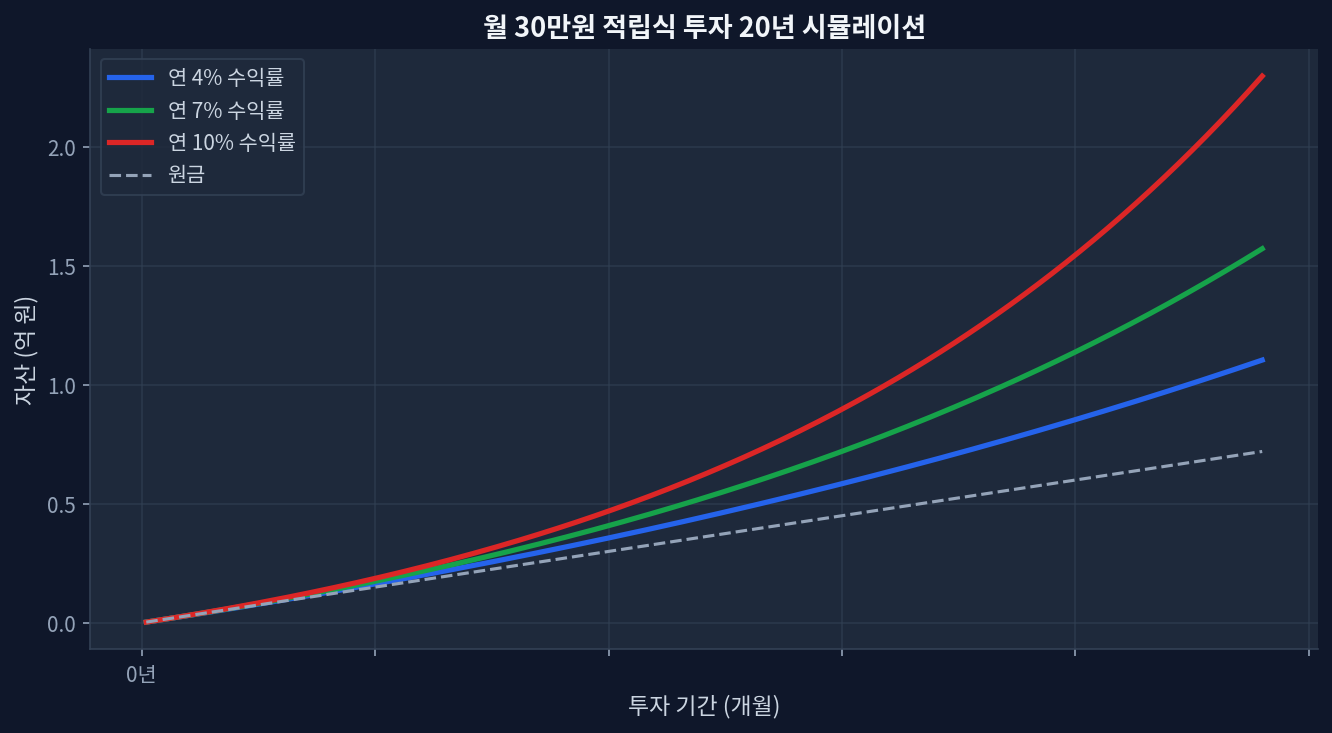
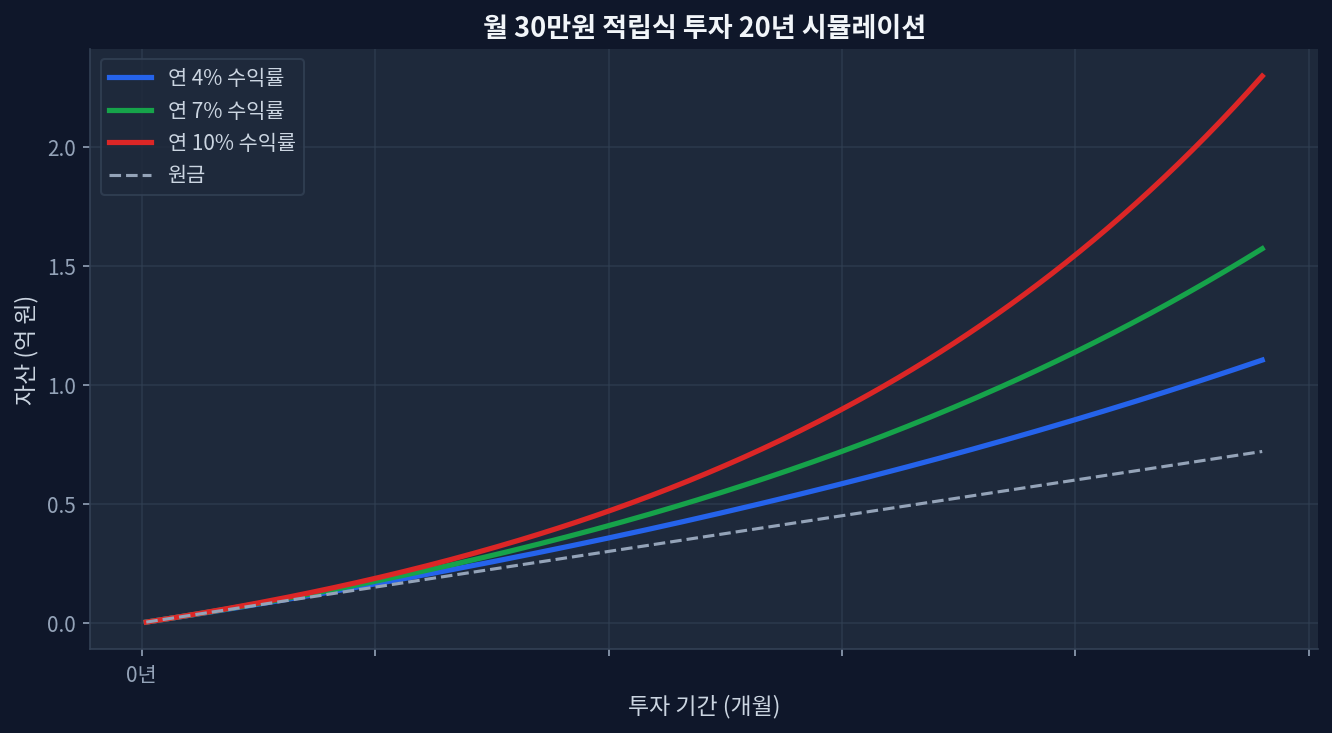
TLT (Vanguard Extended-Term Treasury ETF) delivered -28.4% over 5 years but +5.5% in the last 12 months as rate expectations shifted lowerCurrent price of $86.19 sits at just 36.3% of the 52-week range ($82.77–$92.19), signaling capitulation and limited downside risk4.54% current dividend yield[Yahoo Finance] covers opportunity cost during extended flat-rate periodsDuration math: each 100 basis points of rate decline adds ~8–12% to principal—a 150bps cut cycle targets $94–$97 per shareRisk: inflation resurges or Fed pivots hawkish, trapping investors in yield-on-cost mode with no capital recovery The Hidden Mechanics: Why Long-Duration Bonds Crater Faster Than Equities in Rising Rates volatility-decoded-why-284-loss-masks-a-15-rebound-case/compound-growth.png" alt="Monthly $30K investment 20-year compound growth simulation" loading="lazy" style="max-width:100%;border-radius:8px;">Monthly $30K investment 20-year compound growth simulation Bond mathematics are unforgiving. A bond’s duration measures its sensitivity to rate moves in years: a 15-year duration bond loses 15% for every 1% rise in yields. TLT, tracking 20-year Treasury bonds, carries a duration of roughly 15–16 years. When the Federal Reserve hiked from 0% to 5.5% (March 2022 through July 2023), and the 20-year yield climbed from 1.9% to 4.2%+, TLT’s net asset value collapsed by nearly 30%. ...