JEPI Dividend Calculator — Dividend Reinvestment Simulation

See JEPI’s dividends in numbers JEPI (JPMorgan Equity Premium Income ETF) generates income by combining a low-volatility U.S. equity portfolio with an options-overlay (equity-linked notes). The result is a high distribution and smoother ride, but capped upside in strong rallies. ...

June 14, 2026 · InvestIQs Editorial

JEPQ Dividend Calculator — Dividend Reinvestment Simulation

See JEPQ’s dividends in numbers JEPQ (JPMorgan Nasdaq Equity Premium Income ETF) applies the same equity-premium-income approach as JEPI, but on a Nasdaq-100-style portfolio. Higher growth exposure means higher yield and higher volatility. ...

June 14, 2026 · InvestIQs Editorial

QYLD Dividend Calculator — Dividend Reinvestment Simulation

See QYLD’s dividends in numbers QYLD (Global X NASDAQ 100 Covered Call ETF) writes covered calls on the entire Nasdaq-100, producing a very high distribution. It is an income-maximizing strategy that sacrifices most price appreciation. ...

June 14, 2026 · InvestIQs Editorial

SCHD Dividend Calculator — Dividend Reinvestment Simulation

See SCHD’s dividends in numbers SCHD (Schwab U.S. Dividend Equity ETF) tracks high-quality U.S. companies with a track record of sustained dividend growth, at a very low expense ratio. It is built around dividend growth and balance-sheet quality rather than the highest headline yield. ...

June 14, 2026 · InvestIQs Editorial

VYM Dividend Calculator — Dividend Reinvestment Simulation

See VYM’s dividends in numbers VYM (Vanguard High Dividend Yield ETF) holds a broad, diversified basket of higher-yielding U.S. stocks at an extremely low cost. It favors breadth and low fees over concentration. ...

June 14, 2026 · InvestIQs Editorial
The Hidden Traps of 20-Year DRIP Simulations: Risk and Volatility Anal

The Hidden Traps of 20-Year DRIP Simulations: Risk and Volatility Anal

A 20-year compound growth simulation of Dividend Reinvestment Plans (DRIP) introduces severe tracking errors during drawdown phases. Expense ratios and tax drags act as critical hidden risks frequently omitted from long-term backtesting models. The variance in downside protection between high-yield ETFs (SPYD) and dividend growth ETFs (SCHD) drives a cumulative return divergence exceeding 30%. The 20-year compound interest simulation utilizing a Dividend Reinvestment Plan (DRIP) serves as a persistent marketing instrument within the asset management industry. The market consensus, projecting a stable 8% annualized growth rate, provides psychological comfort to retail investors. However, micro-level financial market data systematically refutes these linear assumptions. Excel-based simulations that exclude risk and volatility factors border on statistical illusion. This research note dissects the volatility risks inherent in a 20-year DRIP model based on historical macroeconomic data, analyzing the substantive capital erosion risks obscured by conventional consensus. ...

May 19, 2026 · InvestIQs Research
20-Year DRIP Reinvestment Simulation: Risk Data vs. Consensus Assumptions

20-Year DRIP Reinvestment Simulation: Risk Data vs. Consensus Assumptions

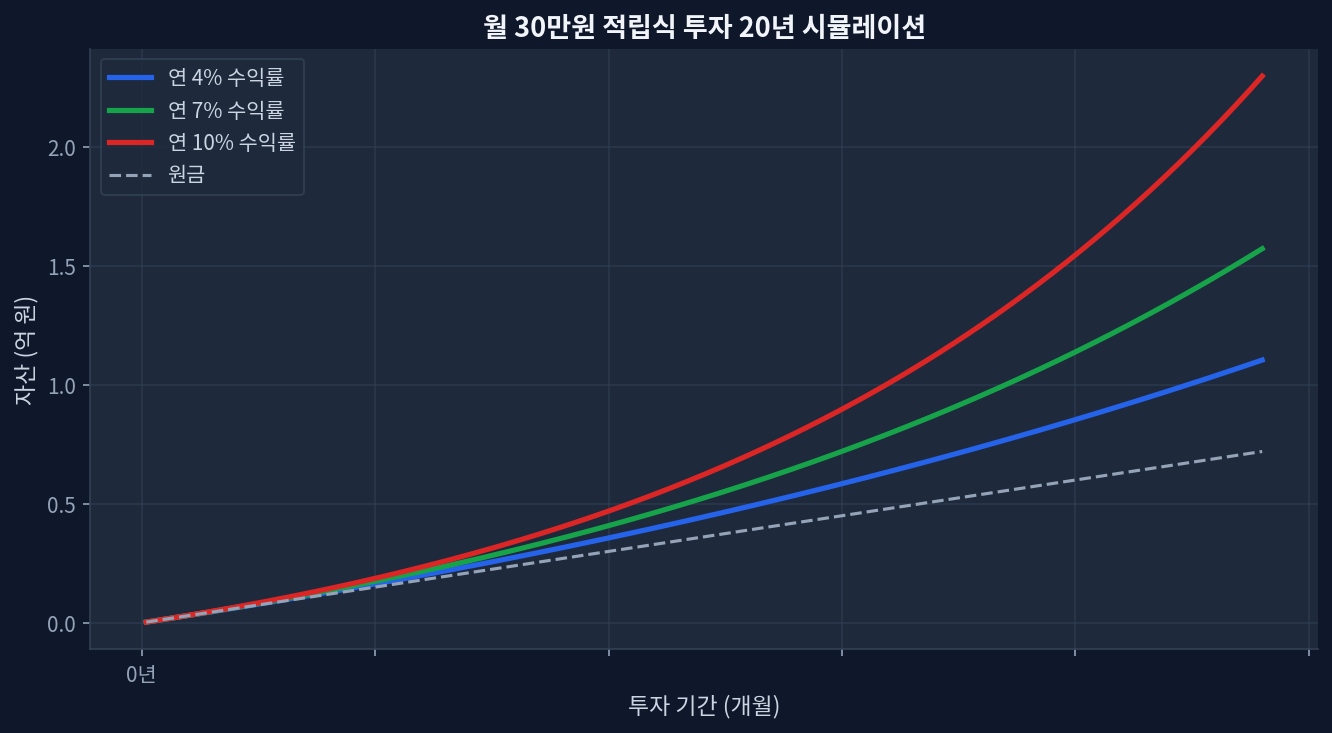
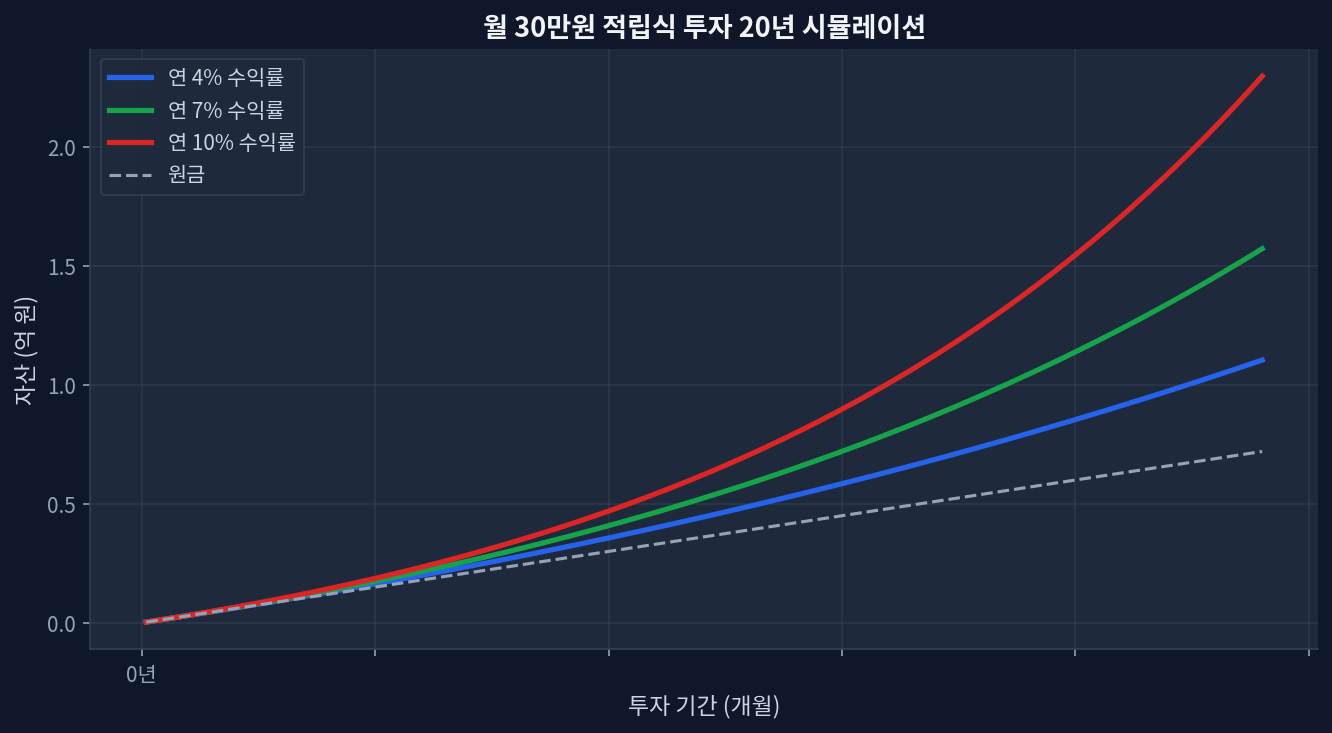
$1,500/month at 7% DRIP CAGR over 20 years = ~$782K; at 4%, ~$550K — a $232K gap driven entirely by the assumed return rateEvery 1% shift in assumed return adds or removes ~$110K–$130K in terminal value at year 20; sensitivity is nonlinearTax drag in taxable accounts reduces effective reinvestment yield by 15–25%; account type is a primary, not secondary, variable2020 S&P dividend cuts (~14% aggregate quarterly reduction) pushed realized DRIP rates 200bps below model assumptions for high-yield ETFsDRIP reinvestors during the Q1 2020 drawdown outperformed non-reinvestors by 12–18% by year-end — a volatility effect flat-line models ignore entirely What the 20-Year Simulation Data Actually Shows Monthly $30K investment 20-year compound growth simulation Running $1,500/month at 4%, 7%, and 10% for 20 years produces a divergence that widens sharply in the back half of the period. At year 10, the gap between the 4% and 10% paths is roughly $200K. By year 20, that gap exceeds $590K. The simulation chart above captures the inflection clearly: the 10% curve breaks away from the 4% path around year 12, when accumulated DRIP dividends begin compounding on themselves at scale.[FRED] ...
May 17, 2026 · InvestIQs Research