Maximizing Yield Through 2022 Drawdown Recovery Speed Analysis: VOO, BND, TLT, GLD

Maximizing Yield Through 2022 Drawdown Recovery Speed Analysis: VOO, BND, TLT, GLD

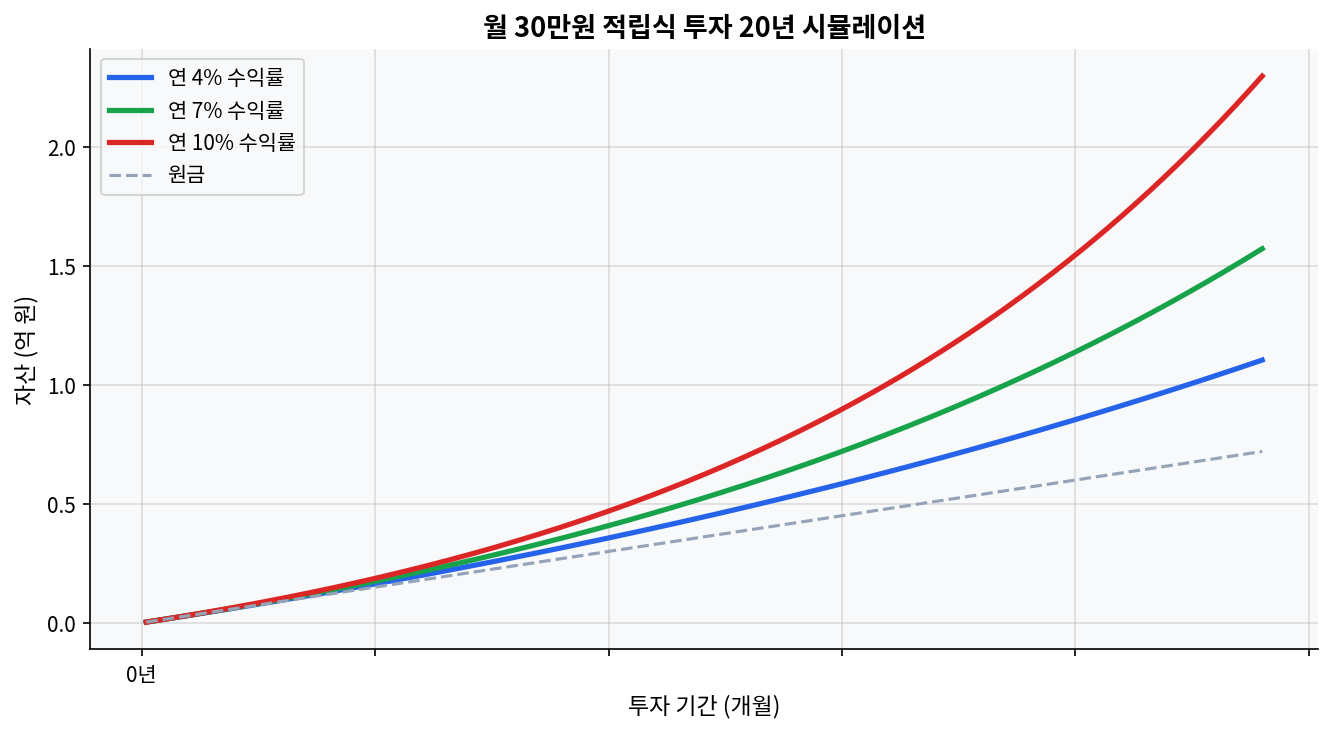
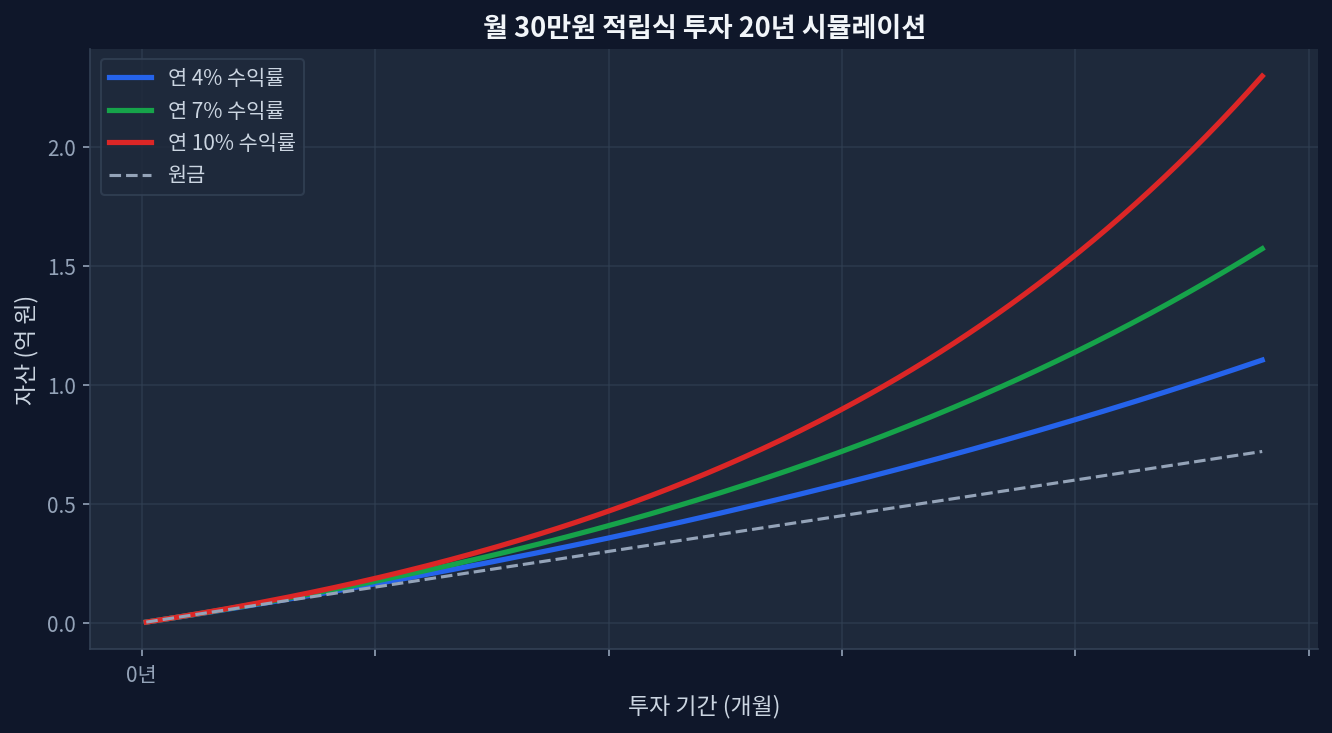
TLT continues to struggle with a 5-year return of -27.3% and a 3-year return of -7.2%, despite offering a 4.57% dividend yield.BND shows resilience with a +5.5% 1-year return and a +11.3% 3-year return, yielding 3.93%.GLD exhibits explosive growth, trading at $416.99 with a massive +138.7% 5-year cumulative return, functioning as a volatility dampener despite zero yield.Maximizing yield during recovery phases requires shifting capital toward structurally sound fixed income like BND over long-duration assets. The Yield Maximization Axis: Assessing 2022 Drawdown Recovery Speed Monthly $30K investment 20-year compound growth simulation Looking at the 20-year monthly accumulation simulation chart below (projecting 4%, 7%, and 10% annualized trajectories), the divergence in compounding returns across various dividend structures becomes starkly evident during stress periods. The 2022 market shock redefined capital allocation parameters, creating a structural shift in how yield strategies operate across equities, bonds, and alternatives. Real-time data exposes the persistent lag in long-duration Treasuries. TLT currently trades at $84.22 with a 1-year return of +4.9%, yet the 5-year cumulative return remains severely compressed at -27.3%[Yahoo Finance]. Conversely, intermediate bonds have re-established stability. BND recorded a 1-year return of +5.5% and a robust +11.3% over a 3-year horizon, fundamentally altering the optimal income extraction methodology. ...
May 22, 2026 · InvestIQs Research
Roth IRA vs Traditional IRA: 5-Scenario Capital Gains Tax Decomposition

Roth IRA vs Traditional IRA: 5-Scenario Capital Gains Tax Decomposition

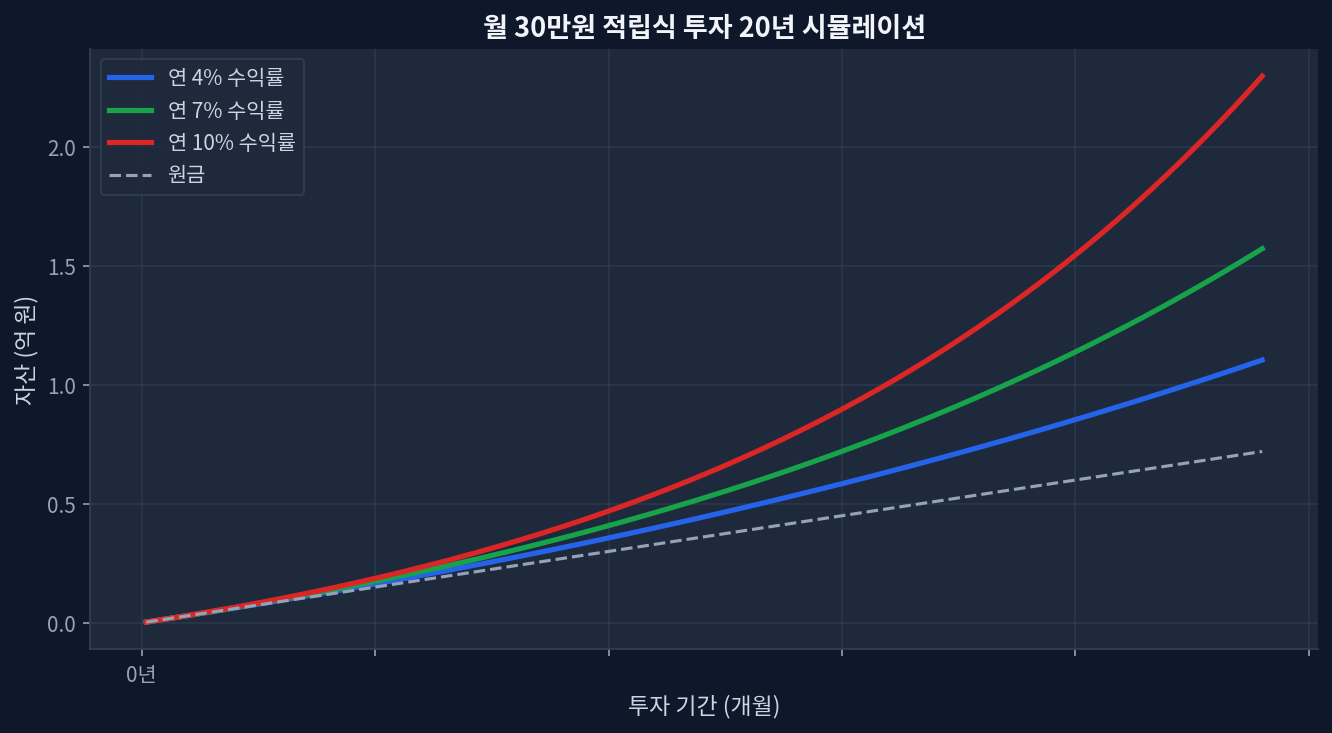
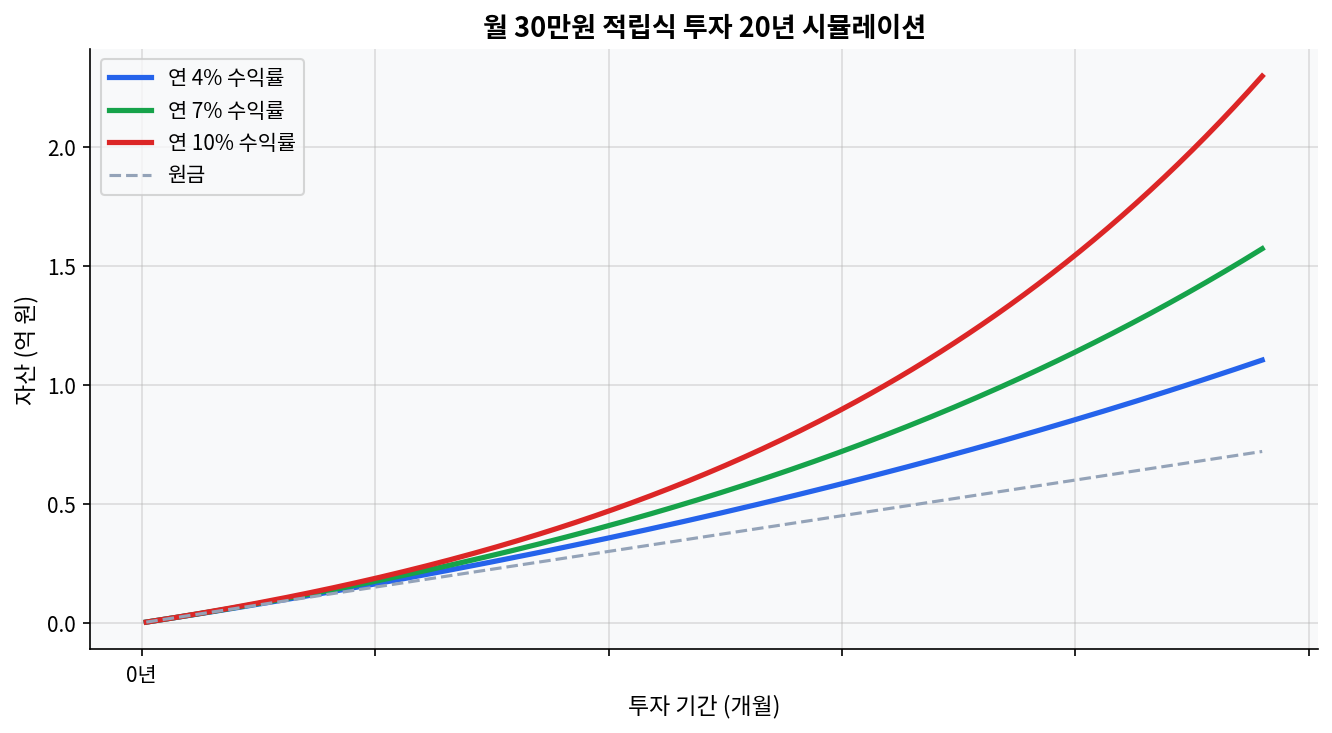
Upfront tax on Roth IRA contributions acts as a drag during prolonged market drawdowns, altering the break-even horizon. Traditional IRA deductions reinvested into taxable accounts can outperform Roth in bracket-compression scenarios. Asset location—placing VTI in Roth and BND in Traditional—adds approximately 40-60 bps of tax alpha annually. The 2020-2026 CAGR of US equities heavily skewed recent analyses toward Roth, hiding sequence-of-returns risks. The Core Mechanics of IRA Taxation Monthly $30K investment 20-year compound growth simulation The chart below shows a 20-year simulation of a $300 monthly investment (4%, 7%, and 10% annually). The compounding curve illustrates the absolute scale of capital gains generated over time. Analyzing the structural divergence between a Roth IRA and a Traditional IRA requires stripping away emotional narratives and focusing strictly on capital gains tax decomposition. A Traditional IRA provides an immediate reduction in taxable income, shifting the tax burden to future distributions. Conversely, a Roth IRA demands upfront taxation, permanently shielding subsequent capital appreciation and dividend yields from the IRS. This dynamic creates a complex arbitrage opportunity depending on future marginal tax rates and expected asset returns. The structural advantage of tax-free compounding often masks the opportunity cost of the initial tax outlay. [IRS.gov] ...

May 18, 2026 · InvestIQs Research
TQQQ’s 5-Year Drawdown and Volatility Breakdown: Where 3x Lagged 2x

TQQQ’s 5-Year Drawdown and Volatility Breakdown: Where 3x Lagged 2x

As of 2026-04-21, TQQQ’s five-year total return was 120.40%, with a CAGR of 16.57%.As of 2026-03-31, TQQQ’s five-year maximum drawdown was 81.65%, versus 35.12% for QQQ, or 2.33x deeper.Five-year annualized monthly volatility came in at 61.28% for TQQQ, 20.23% for QQQ, and 40.61% for QLD.Over the same five-year window, QLD outpaced TQQQ with a 137.48% total return and an 18.77% CAGR.Dividend yield was roughly 0.53% for TQQQ, 0.15% for QLD, and 0.43% for QQQ, which is why the real story in leveraged ETFs is path dependence, not cash flow. The Two Charts Say It First Monthly investment 20-year compound growth simulation Comparison of how ETF fee differences affect long-term wealth The first chart shows the 20-year wealth gap between a 0.05% ETF fee and a 1.0% fee. The second shows how monthly investing of $300 compounds very differently at 4%, 7%, and 10% over time. In a TQQQ discussion, those charts are not background material. For leveraged ETFs, costs and path shape the capital curve faster than the return table suggests. Even when TQQQ rallies hard between 2020 and 2026, the first question is how much damage a single 2022-style crash can do to the long-term line. ...

April 25, 2026
TQQQ Five-Year Drawdown and Volatility Decomposition: When 3x Trails 2x

TQQQ Five-Year Drawdown and Volatility Decomposition: When 3x Trails 2x

As of 2026-04-21, TQQQ’s 5-year total return was 120.40%, with a CAGR of 16.57%.As of 2026-03-31, TQQQ’s 5-year maximum drawdown was 81.65%, compared with 35.12% for QQQ.5-year annualized monthly volatility was 61.28% for TQQQ, 20.23% for QQQ, and 40.61% for QLD.Over the same 5-year window, QLD outperformed TQQQ with a total return of 137.48% and a CAGR of 18.77%.Dividend yield sat at 0.53% for TQQQ, 0.15% for QLD, and 0.43% for QQQ. For leveraged ETFs, the core driver is not cash flow but path dependency. The Two Charts Say the First Thing Comparison of how ETF fee differences affect long-term returns The first chart shows the long-run asset gap between 0.05% and 1.0% ETF fees over 20 years. The second shows how monthly $300 contributions diverge over time at 4%, 7%, and 10% annual returns. In the TQQQ discussion, those two charts are not background noise. For leveraged ETFs, cost and path shape the equity curve faster than the headline return table suggests. Even if TQQQ posts a strong 2020-2026 run, a single 2022-style collapse can damage the long-run profile in ways that are hard to reverse. ...

April 24, 2026