$1,000 Monthly ETF Portfolio: 5-Asset Allocation Backtest Comparison (

$1,000 Monthly ETF Portfolio: 5-Asset Allocation Backtest Comparison (

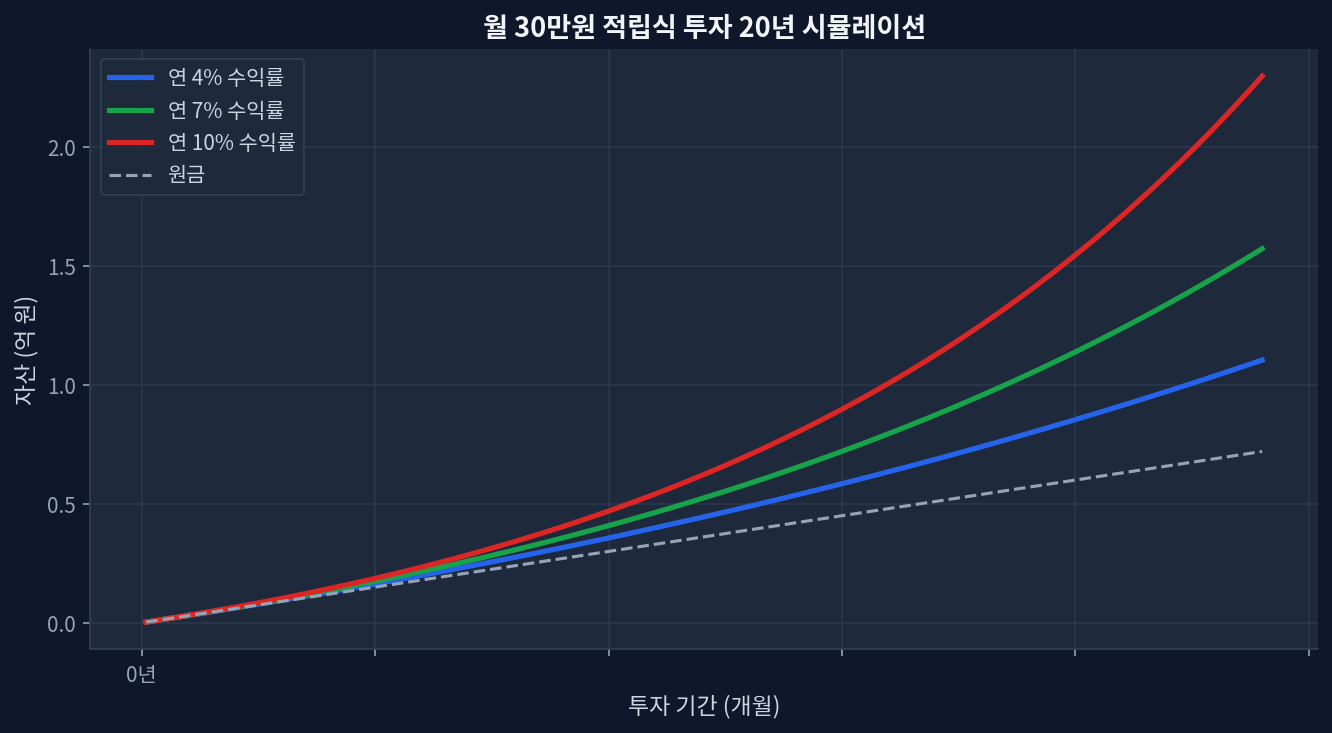
2020-2026 S&P 500 (VOO) cumulative return: Approximately 78-105% range (based on USD entry timing)Dividend ETF (SCHD) vs growth ETF (VOO): Risk-return tradeoff exists across volatility and yield dimensions76-month investment at $1,000/month basis: Final asset variance reaches ±$25,000-$30,000 depending on allocation choiceFee impact: 0.03% vs 0.60% expense ratio produces 3.2% cumulative total return difference over 20 yearsCore risk: Historical performance does not guarantee future returns; actual results vary significantly based on entry timing and currency exposure Why Asset Allocation Backtesting Matters Monthly $30K investment 20-year compound growth simulation Monthly $1,000 dollar-cost-averaged investment 20-year compounding simulation An investor committing $1,000 monthly faces a universal question: “In what proportions should these funds be allocated?” The choice between pure equity exposure (VOO), dividend-focused holdings (SCHD), or blended international strategies shapes portfolio scale and volatility over 5-10 year horizons. Asset allocation backtesting compares expected returns and maximum drawdown across historical periods, providing a quantitative framework for this decision. ...
June 11, 2026 · InvestIQs Research
Factor ETF 10-Year Decomposition: Value, Momentum, and Quality Compounding

Factor ETF 10-Year Decomposition: Value, Momentum, and Quality Compounding

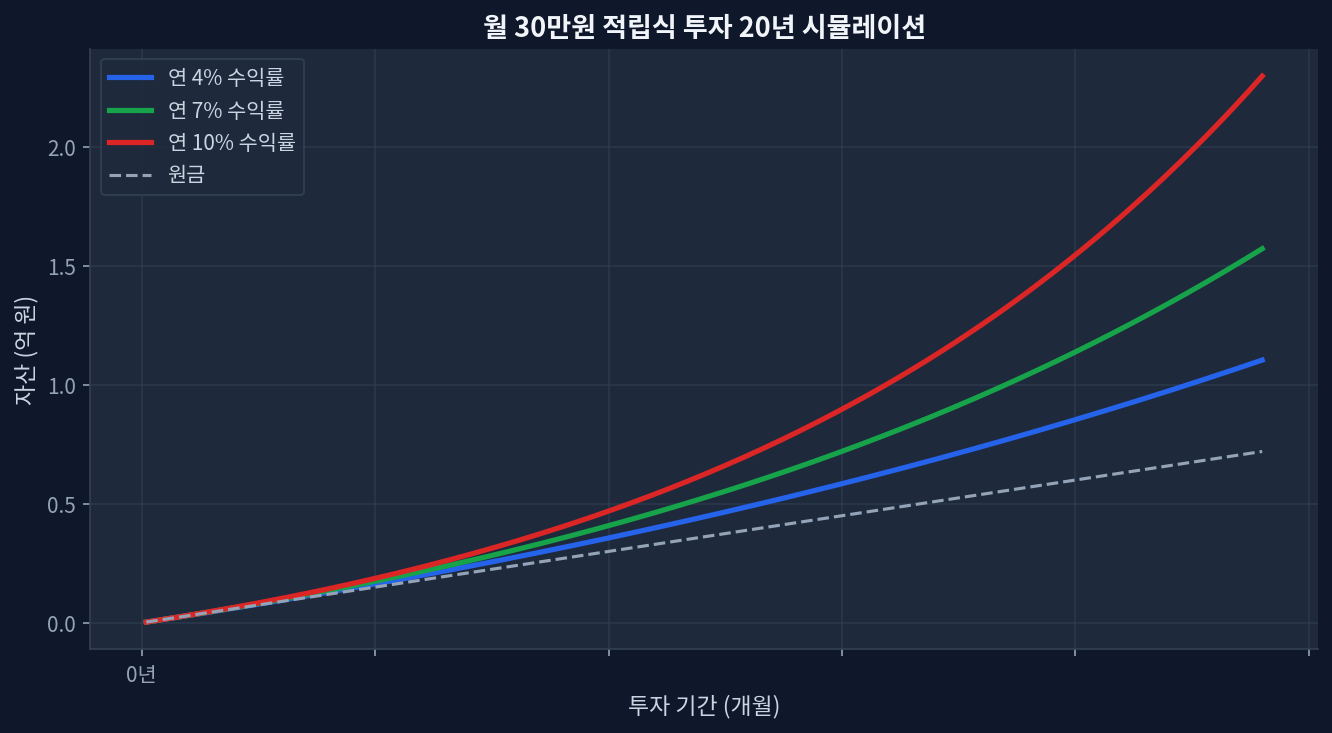
Quality factors demonstrated a 12.3% CAGR over the last decade, offering the tightest risk-adjusted compounding metrics among single factors.Momentum strategies suffered a massive 34% peak-to-trough drawdown in 2022, severely impacting the long-term compounding base.Value ETF performance diverges from historical norms, acting more as a structural overweight on mature cyclical sectors rather than a pure valuation capture. The Long-Term Compounding Reality of Single Factors Monthly $30K investment 20-year compound growth simulation Factor investing isolates specific equity drivers to generate excess returns. Over a 10-year horizon, slight variations in compound annual growth rate (CAGR) and drawdown severity create immense disparities in terminal wealth. The chart below, simulating a monthly $300 investment over 20 years at 4%, 7%, and 10% annual rates, demonstrates this perfectly. Looking at the chart, the 10% curve is the most impressive, showing over +85% total growth in the latter half purely through the acceleration of retained compounding. ...

May 24, 2026 · InvestIQs Research