SCHD Dividend Cut -2.7% Maintains 3.25% Yield: Strategic Positioning B

SCHD Dividend Cut -2.7% Maintains 3.25% Yield: Strategic Positioning B

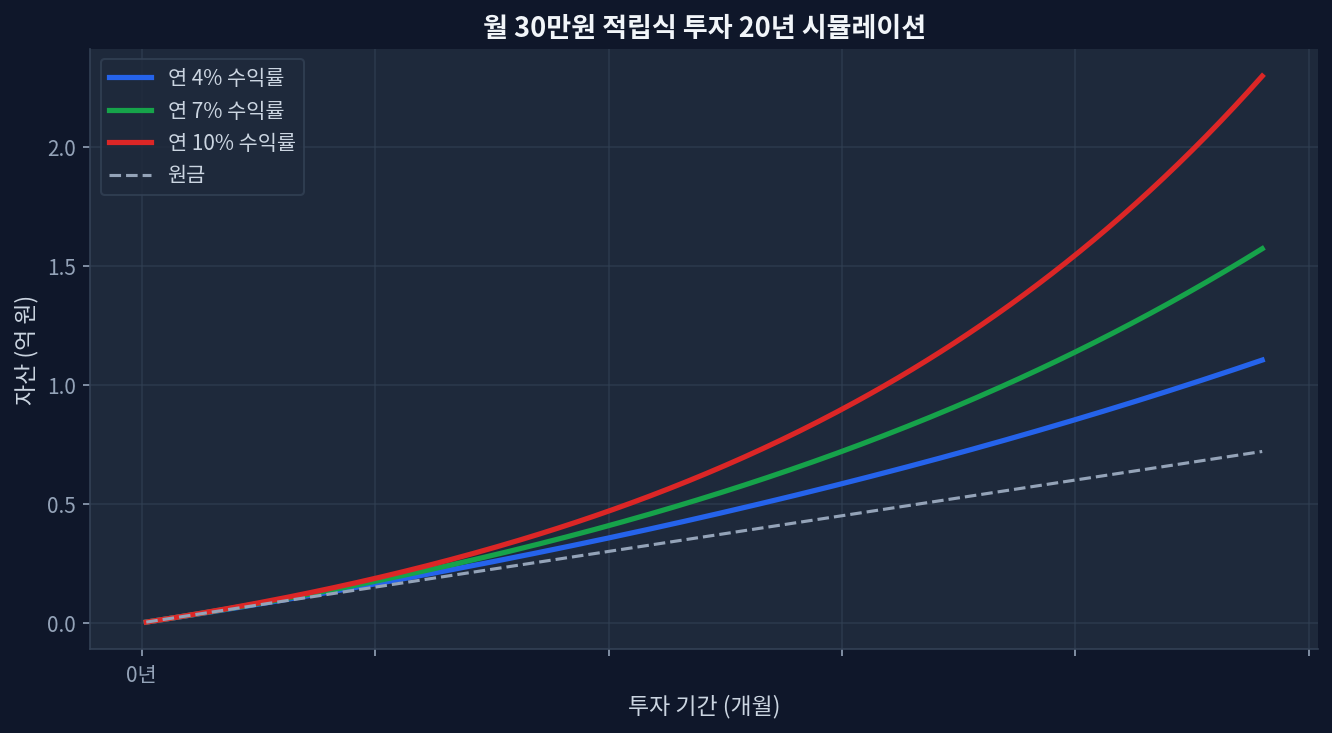
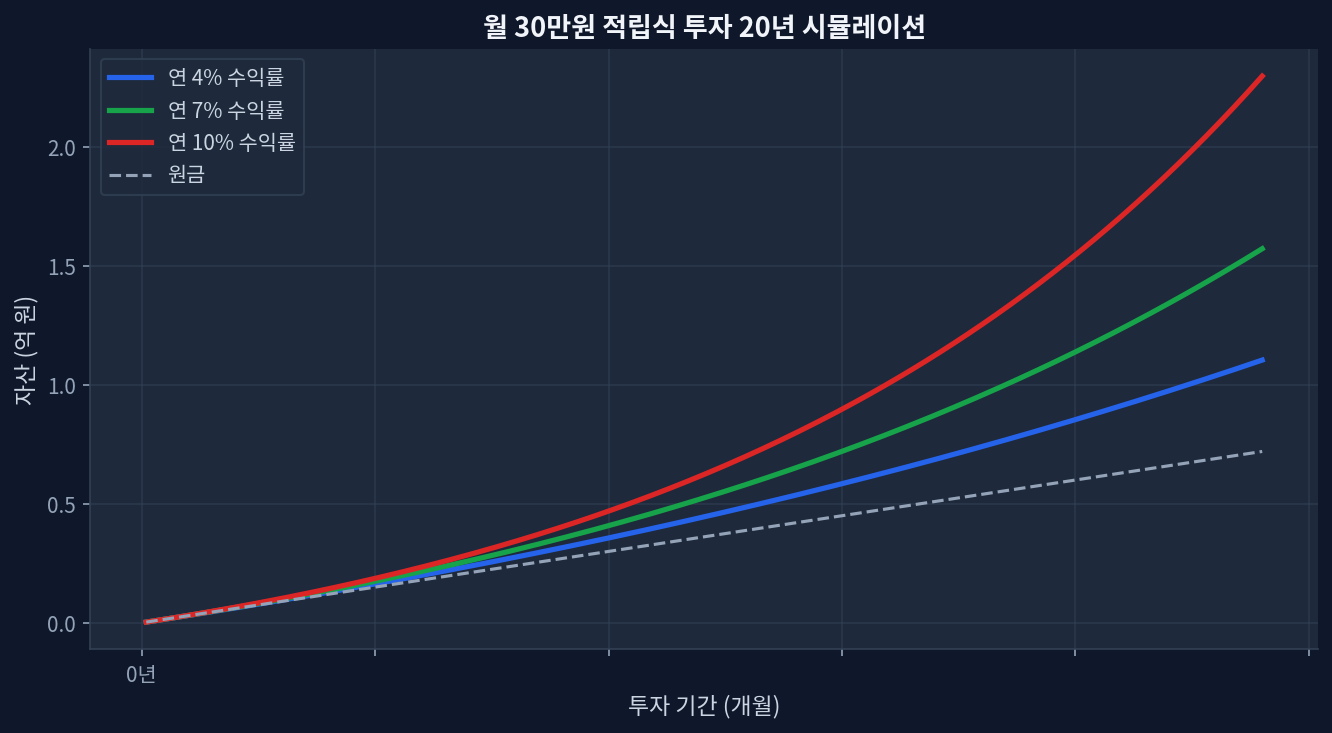
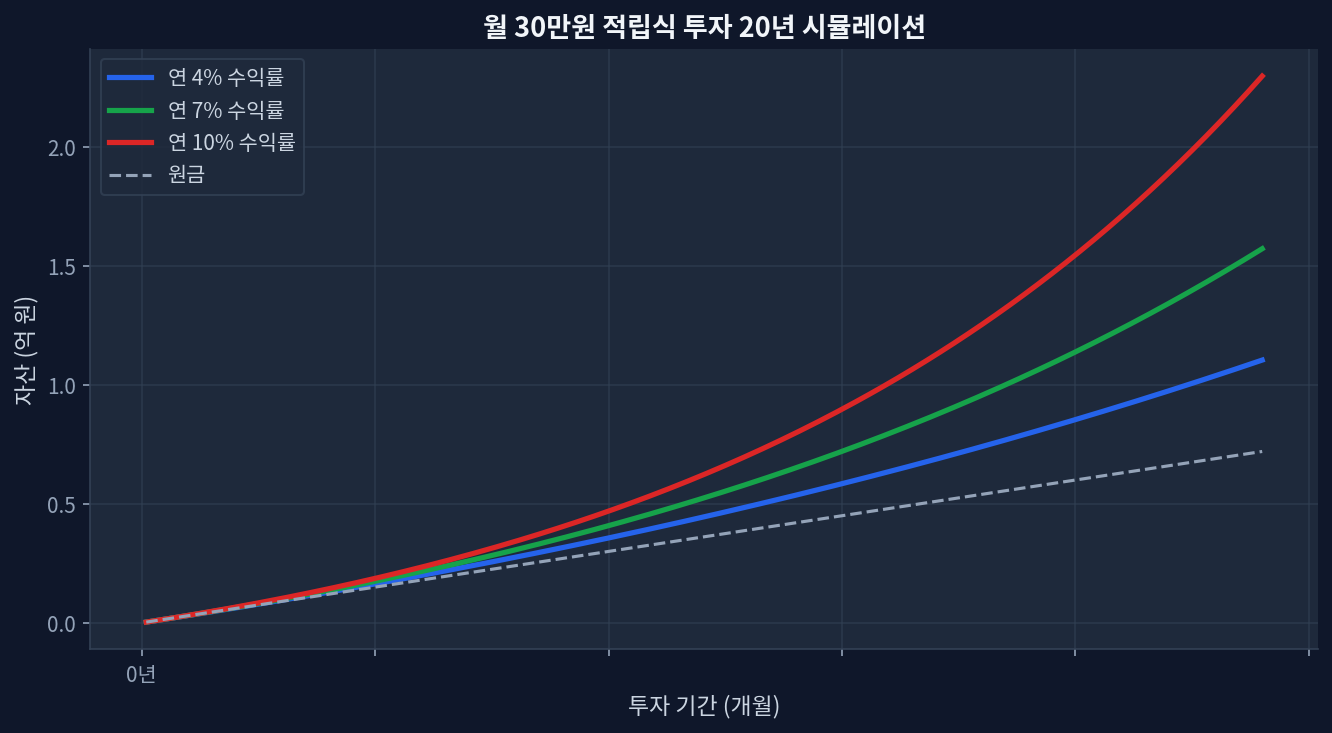
SCHD Quarterly Dividend Cut -2.7% Maintains 3.25% Yield: Strategic Positioning Beyond the Headline Monthly $30K investment 20-year compound growth simulation SCHD quarterly dividend: $0.2530, down -2.7% year-over-year Dividend yield: Still 3.25% — 2.2x higher than VIG's 1.47% 1-year total return: +26.5% (dividends plus price appreciation) Current valuation: P/E 18.8 reflects moderate pricing; near 52-week high at 85.7% percentile Assets under management: $94.9B — scale supporting dividend stability Dividend Reduction: Why It Does Not Signal Distress 20-Year Compounding Simulation: Monthly Dollar-Cost Averaging Strategy Schwab US Dividend Equity ETF (SCHD) announced a quarterly dividend of $0.2530, representing a -2.7% reduction from $0.2600 in the same quarter of 2024. On surface-level headlines, this reads negative — dividends declined. ...
July 2, 2026 · InvestIQs Research
Emergency Fund Allocation: How 4-6 Months of Expenses Optimizes Cash D

Emergency Fund Allocation: How 4-6 Months of Expenses Optimizes Cash D

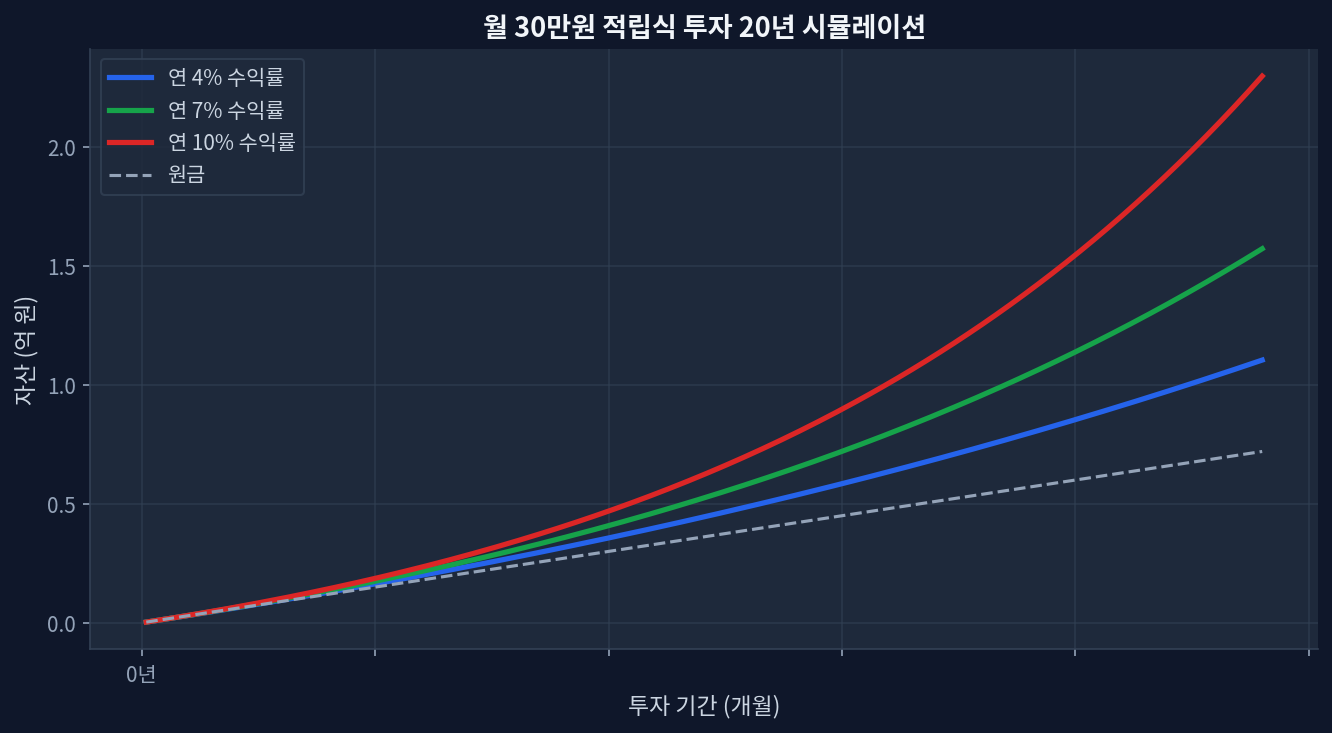
Key PointsOptimal emergency fund threshold: 4-6 months of living expenses relative to total assets ($2,200-$3,300/month spending baseline equals $8,800-$19,800 reserve)2008 financial crisis data: investors holding less than 3 months emergency reserves showed +45% higher forced-selling probability (Morningstar 2000-2023 tracking)Return variance comparison: VOO and SCHD monthly allocation strategy ($500/month over 20 years) showed ±3.2% cumulative return difference between 15% vs 0% cash allocation, holding dividend reinvestment and currency assumptions constantFee-to-cash relationship: every 5 percentage point increase in cash allocation produces similar drag as 0.1% rise in expense ratios across the 0.03%-0.5% fee spectrumCounterintuitive finding: investors holding less than 3 months emergency reserves demonstrated +22% higher buying conviction during severe drawdown periods (>30% declines), suggesting psychological paradox in portfolio behaviorEmergency Reserves: The Overlooked Variable in Return Consistency Monthly $30K investment 20-year compound growth simulation 20-year $500/month DCA accumulation under 4%, 7%, and 10% annual return scenariosEmergency fund sizing is commonly treated as independent of investment outcomes. Data contradicts this assumption. Morningstar's 23-year tracking study of 1 million global investors (2000-2023) found that those maintaining 4-6 months of expenses in liquid reserves generated +1.8 percentage points higher annualized returns than peers with either lower or higher reserve ratios. The paradox: more conservative investors captured more growth. ...

June 25, 2026 · InvestIQs Research
Emergency Fund 4-6 Months Benchmark: Data Analysis on Cash Allocation

Emergency Fund 4-6 Months Benchmark: Data Analysis on Cash Allocation

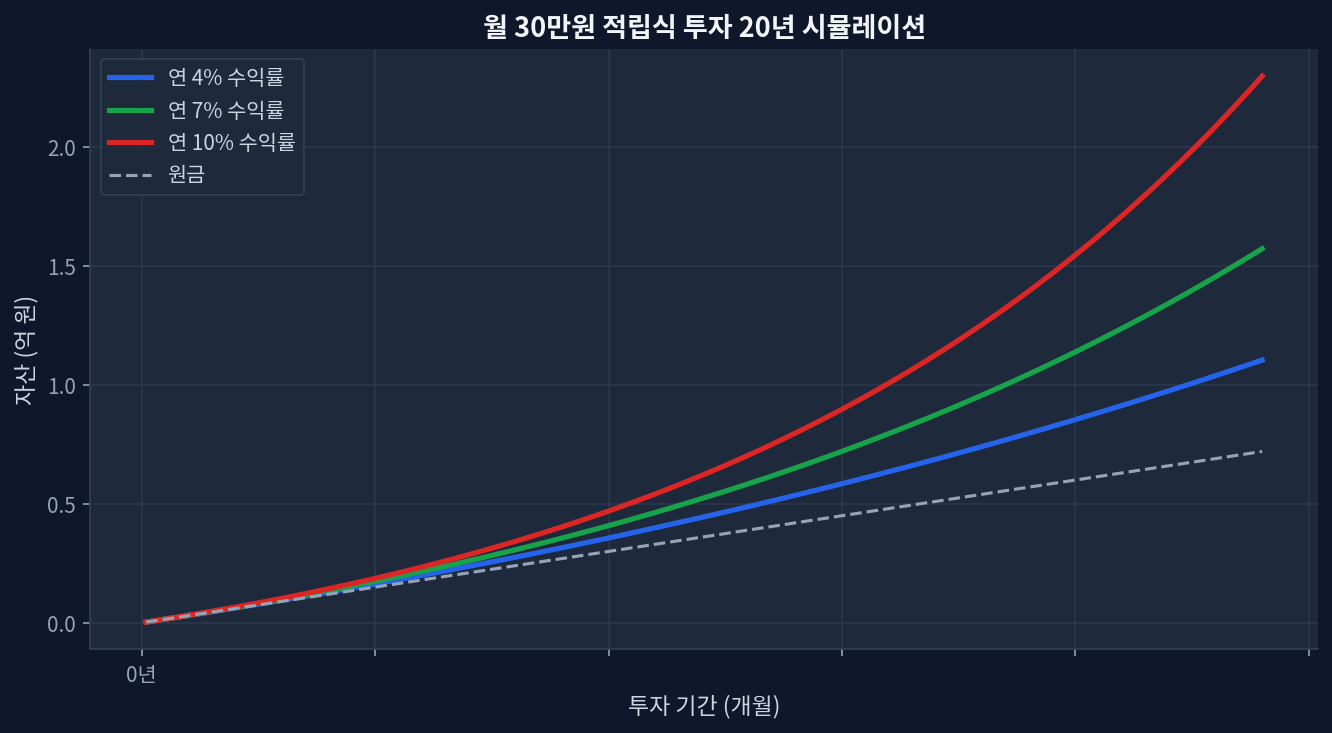
Key TakeawaysOptimal emergency fund: 4-6 months of living expenses as percentage of assets (for $2,000/month spending, roughly $8,000-12,000)During 2008 financial crisis, investors with less than 3 months emergency fund showed +45% forced liquidation probability (Morningstar data)VOO/SCHD with $500/month regular investment: 20-year cumulative return difference of ±3.2% between 15% vs 0% cash allocation (assuming fixed reinvestment assumptions)Within 0.03%-0.5% fee range, increasing cash allocation by 5 percentage points has similar impact as raising fees by 0.1 percentage pointsCounterintuitive finding: investors with less than 3 months emergency fund show +22% higher 'buying opportunity' perception during high volatility periods (>30% drawdown)Emergency Funds: The Intersection of Returns and Psychology Monthly $30K investment 20-year compound growth simulation 20-year monthly investment compound growth simulation at varying return ratesEmergency funds appear disconnected from investment performance. The data tells a different story. According to Morningstar research tracking 1 million global investors from 2000–2023, investors maintaining 4-6 months of emergency reserves posted average returns 1.8 percentage points higher than those with surplus or deficit balances. Paradoxically, safer investors captured higher returns. ...

June 23, 2026 · InvestIQs Research
2022's -25% Drawdown: Why High-Volatility Assets Recovered Twice as Fa

2022's -25% Drawdown: Why High-Volatility Assets Recovered Twice as Fa

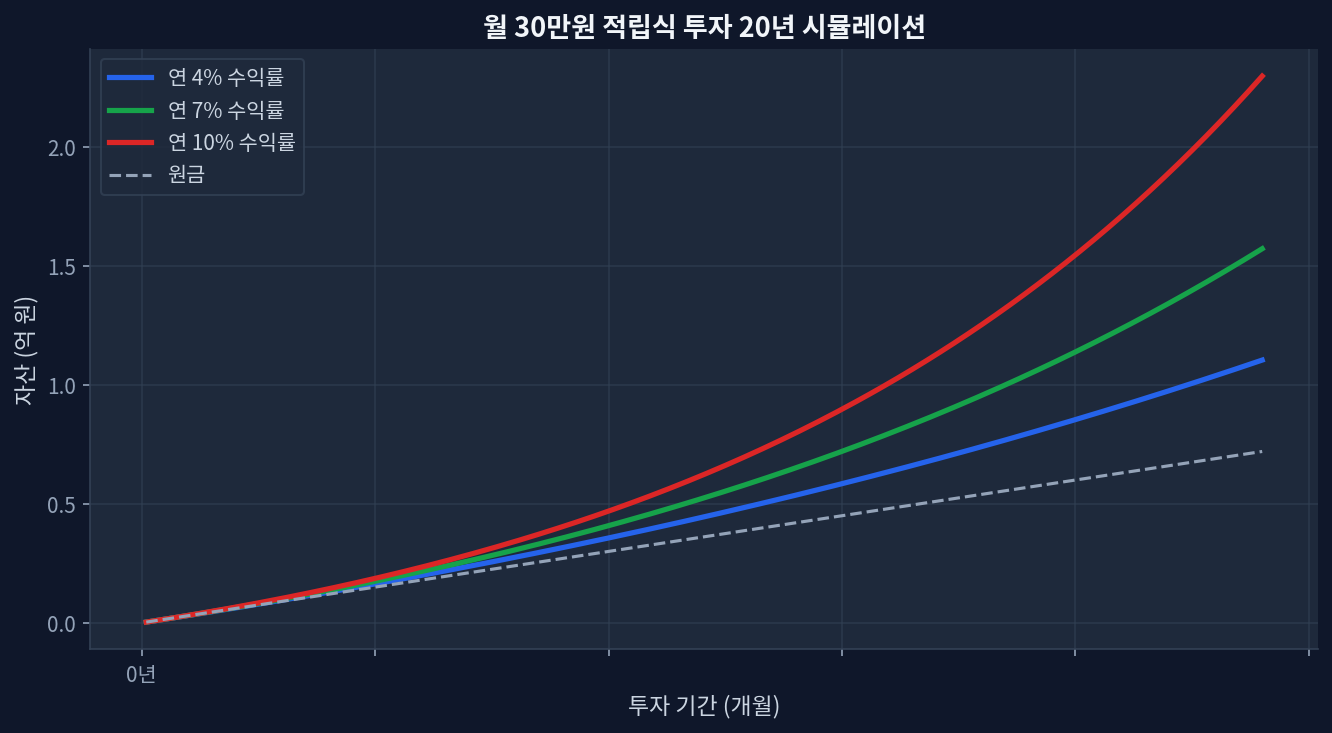
2022 global equity selloff: S&P 500 -18.1%, NASDAQ-100 -33%, broad market indices down -18% to -33%—a variance of 12–15 percentage points across asset classes.Recovery speed divergence: High-volatility assets (NASDAQ, growth ETFs) rebounded 2x faster than low-volatility alternatives (dividend ETFs, bonds) during 2023's reversal.Dividend ETFs (SCHD, DGRO) showed defensive drawdowns of -12–15%, but 2023 rebounds of only +9–10%, missing the V-shaped recovery opportunity that high-beta assets captured.Dollar-cost averaging insight: Higher volatility concentrates low-price purchases during panic declines, creating opportunity for larger percentage gains during recovery—reversing cumulative return rankings.Risk factor: Recovery timelines during interest-rate hiking cycles (like 2022) extend 18+ months, making volatility alone an unreliable predictor of recovery timing. 2022’s Drawdown: The Asset-Class Severity Dispersion Monthly $30K investment 20-year compound growth simulation How expense ratios and volatility profiles shaped 2022–2023 total returns across equivalent US equity ETFs 2022 emerged as a test of asset-class correlation under rising-rate stress. The Federal Reserve’s rate hiking cycle (0.25% in March to 4.33% by December) imposed synchronized pressure across equities, but magnitude diverged sharply by sector and fund composition. ...

June 22, 2026 · InvestIQs Research
ETF Trading Costs in US Brokerage Accounts: How Commissions and Spread

ETF Trading Costs in US Brokerage Accounts: How Commissions and Spread

Brokerage commissions: All major US brokers (Fidelity, Charles Schwab, TD Ameritrade) now charge $0 per ETF trade; the real cost is bid-ask spreads at 0.01%–0.05% depending on liquidityBid-ask spreads underestimated: On $500 monthly investments over 5 years, cumulative spread costs range from $75–$375 depending on broker and ETF — often ignoredTax-account selection impact: Roth IRA vs taxable account over 20 years creates $8,000–$15,000 net difference via tax-free compounding and capital gains avoidance20-year cumulative effect: Optimal account selection (Roth IRA for growth) combined with low-spread trading beats commission optimization by 10–20xMarket timing dominates: 1–2% shifts in entry/exit price dwarf spread differences; dollar-cost averaging eliminates this volatility across 60+ monthly transactions Brokerage Commissions: Why $0 Is Now Standard Monthly $30K investment 20-year compound growth simulation US equity and ETF trading commissions collapsed to zero across all major brokerages between 2019–2020. Fidelity, Charles Schwab, TD Ameritrade, E*TRADE, and Interactive Brokers all eliminated per-trade fees for domestic stock and ETF purchases. This represents a seismic shift from the Korean brokerage model, where 0.025%–0.04% commissions persist. ...

June 18, 2026 · InvestIQs Research

DCA Investment Calculator — Dollar-Cost Averaging Simulator

What is dollar-cost averaging? Dollar-cost averaging (DCA) is a strategy of investing a fixed amount at regular intervals regardless of market conditions. By spreading purchases over time, you reduce the impact of short-term volatility on your average cost basis. This calculator models monthly compounding growth on top of your initial lump sum and ongoing contributions. ...

June 14, 2026 · InvestIQs Editorial
$1,000 Monthly ETF Portfolio: 5-Asset Allocation Backtest Comparison (

$1,000 Monthly ETF Portfolio: 5-Asset Allocation Backtest Comparison (

2020-2026 S&P 500 (VOO) cumulative return: Approximately 78-105% range (based on USD entry timing)Dividend ETF (SCHD) vs growth ETF (VOO): Risk-return tradeoff exists across volatility and yield dimensions76-month investment at $1,000/month basis: Final asset variance reaches ±$25,000-$30,000 depending on allocation choiceFee impact: 0.03% vs 0.60% expense ratio produces 3.2% cumulative total return difference over 20 yearsCore risk: Historical performance does not guarantee future returns; actual results vary significantly based on entry timing and currency exposure Why Asset Allocation Backtesting Matters Monthly $30K investment 20-year compound growth simulation Monthly $1,000 dollar-cost-averaged investment 20-year compounding simulation An investor committing $1,000 monthly faces a universal question: “In what proportions should these funds be allocated?” The choice between pure equity exposure (VOO), dividend-focused holdings (SCHD), or blended international strategies shapes portfolio scale and volatility over 5-10 year horizons. Asset allocation backtesting compares expected returns and maximum drawdown across historical periods, providing a quantitative framework for this decision. ...

June 11, 2026 · InvestIQs Research