Samsung Dividend Reinvestment: Path to 8% Annual Returns Over 5 Years

Samsung Dividend Reinvestment: Path to 8% Annual Returns Over 5 Years

Key TakeawaysSamsung's historical dividend yield averaged 3.2–4.5% over 2020–2026; combined with share-price appreciation, 8% annualized return requires steady market conditionsMonthly $1,500 reinvestment compounds differently across tax-advantaged (Roth/401k) vs. taxable accounts—15% US tax treaty on Korean dividends applies in taxable onlyCurrency risk: KRW/USD volatility can erase 2–3% of gains in down years; hedging costs further reduce net returnsDiscipline matters most—missing dividend reinvestment windows or trading on emotion derails the 8% target more than stock selectionFive-year timeframe is short for equity positions; drawdowns of 20–30% during market corrections are normal and must be endured What 8% Annual Returns Actually Means for Samsung Investors Monthly $30K investment 20-year compound growth simulation Achieving 8% annualized returns on Samsung Electronics over five years requires three moving parts to align: dividend income, share price appreciation, and reinvestment discipline. Most retail investors focus only on the dividend (the visible 3.5% yield) and ignore the harder half—growth and compounding. Samsung’s stock price, denominated in Korean Won, adds an extra layer of complexity: FX exposure can boost returns in strong dollar periods or shred them when the Won appreciates. The math looks clean on a spreadsheet; the reality is messier. ...
June 27, 2026 · InvestIQs Research

JEPI Dividend Calculator — Dividend Reinvestment Simulation

See JEPI’s dividends in numbers JEPI (JPMorgan Equity Premium Income ETF) generates income by combining a low-volatility U.S. equity portfolio with an options-overlay (equity-linked notes). The result is a high distribution and smoother ride, but capped upside in strong rallies. ...

June 14, 2026 · InvestIQs Editorial

JEPQ Dividend Calculator — Dividend Reinvestment Simulation

See JEPQ’s dividends in numbers JEPQ (JPMorgan Nasdaq Equity Premium Income ETF) applies the same equity-premium-income approach as JEPI, but on a Nasdaq-100-style portfolio. Higher growth exposure means higher yield and higher volatility. ...

June 14, 2026 · InvestIQs Editorial

QYLD Dividend Calculator — Dividend Reinvestment Simulation

See QYLD’s dividends in numbers QYLD (Global X NASDAQ 100 Covered Call ETF) writes covered calls on the entire Nasdaq-100, producing a very high distribution. It is an income-maximizing strategy that sacrifices most price appreciation. ...

June 14, 2026 · InvestIQs Editorial

SCHD Dividend Calculator — Dividend Reinvestment Simulation

See SCHD’s dividends in numbers SCHD (Schwab U.S. Dividend Equity ETF) tracks high-quality U.S. companies with a track record of sustained dividend growth, at a very low expense ratio. It is built around dividend growth and balance-sheet quality rather than the highest headline yield. ...

June 14, 2026 · InvestIQs Editorial

VYM Dividend Calculator — Dividend Reinvestment Simulation

See VYM’s dividends in numbers VYM (Vanguard High Dividend Yield ETF) holds a broad, diversified basket of higher-yielding U.S. stocks at an extremely low cost. It favors breadth and low fees over concentration. ...

June 14, 2026 · InvestIQs Editorial
TIGER & QQQ: 5-Year Tech Concentration Returns Under the Microscope

TIGER & QQQ: 5-Year Tech Concentration Returns Under the Microscope

5-year return: QQQ gained +120.7%, QQQM +121.6% — both tracking Nasdaq-100 within basis pointsM7 concentration: ~40% portfolio weight in mega-cap tech; amplifies gains in bull markets but volatility-decomposition-when-3x-trails-2x/">drawdown risk spikes during rotationDividend yield: QQQ 0.39%, QQQM 0.43% — meaningful for reinvestment over 5+ yearsEntry timing matters: Starting in March 2020 (bottom) vs November 2021 (peak) produces 40%+ return variance by 2026Scale advantage: QQQ ($494B AUM) vs QQQM ($96.9B) — liquidity differs; TIGER sits between them The 5-Year Test: What Actually Happened Monthly $30K investment 20-year compound growth simulation From March 2020 to June 2026, both QQQ and QQQM delivered a +120% total return[Yahoo Finance]. On paper, this makes tech-heavy ETFs look like a no-brainer. But the path mattered enormously. The Nasdaq-100 surged 180% between the March 2020 lows and November 2021 peak, then reversed sharply through 2022. Investors who held through both legs netted gains; those who panicked in the 2022 drawdown sold near lows and never participated in the 2023–2026 recovery. ...

June 13, 2026 · InvestIQs Research
Tax-Advantaged Account ETF Allocation: 5-Year Effective Tax Rate Analy

Tax-Advantaged Account ETF Allocation: 5-Year Effective Tax Rate Analy

Operating US-listed ETFs within a tax-advantaged account (Roth IRA) reduces the effective tax rate on long-term gains and qualified dividends from 15% (taxable) to 0%. Contrary to the high-yield narrative, focusing on total return (TR) and automated dividend reinvestment (DRIP) structurally maximizes the tax-deferral compounding effect. Strategic asset location over a 5-year horizon serves as the primary driver for compounding total returns. Tax-Advantaged Account Structures and 5-Year Efficacy Taxable Brokerage vs Traditional IRA vs Roth IRA Tax Effect Comparison From an asset allocation perspective, the structural advantages of tax-sheltered accounts are highly pronounced. A taxation system that levies annual taxes on dividend income and realized capital gains in standard brokerage accounts introduces significant drag on a portfolio’s compounding trajectory. Analyzing the ‘Taxable vs Roth IRA After-Tax Return (10,000 USD, 10 Years)’ data, the compounding curve of tax-deferred or tax-free assets exhibits superior resilience and a steeper growth rate compared to standard taxable accounts over long horizons. Specifically, the tax treatment of dividend distributions over a 5-year period acts as a critical variable controlling the portfolio’s effective tax drag. The compounding effect of reinvested capital is subtle in initial years but drives the aggregate asset growth exponentially over time. [ETF[.com]](https://www.etf.com) ...

May 21, 2026 · InvestIQs Research
20-Year DRIP Reinvestment Simulation: Risk Data vs. Consensus Assumptions

20-Year DRIP Reinvestment Simulation: Risk Data vs. Consensus Assumptions

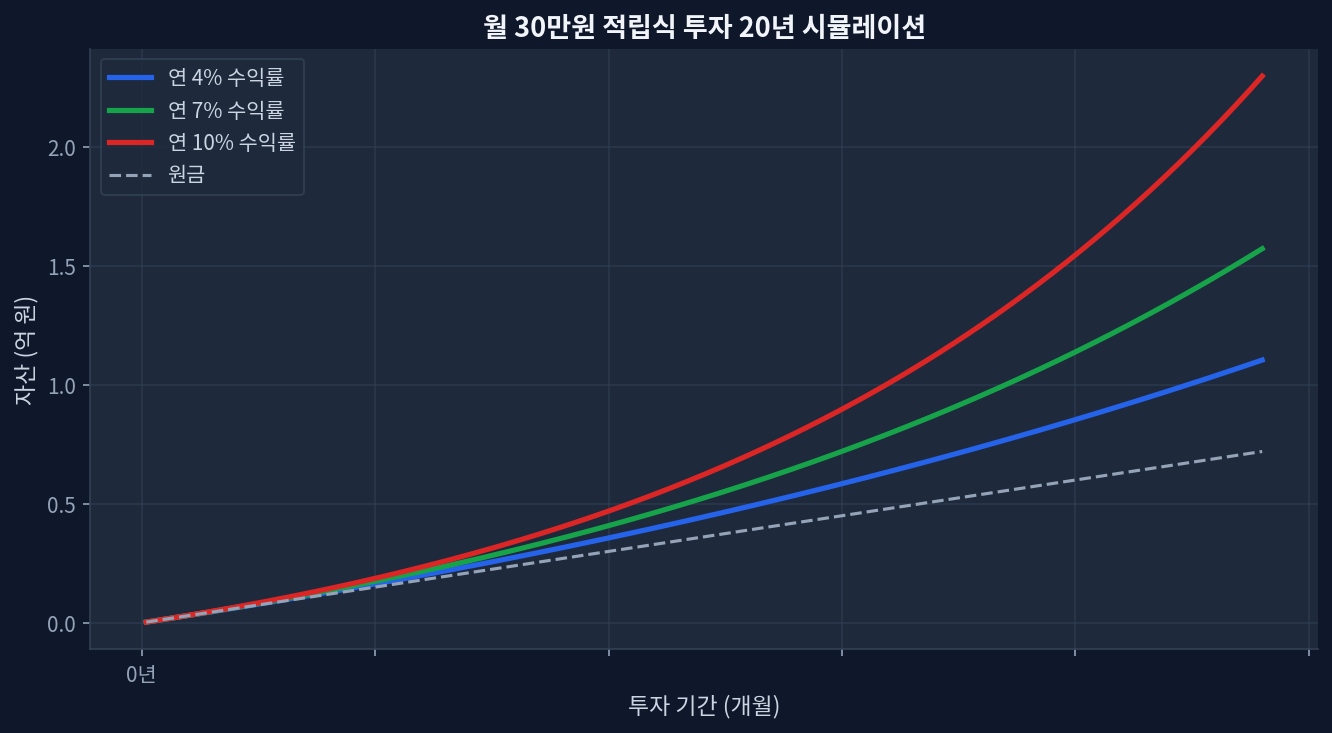
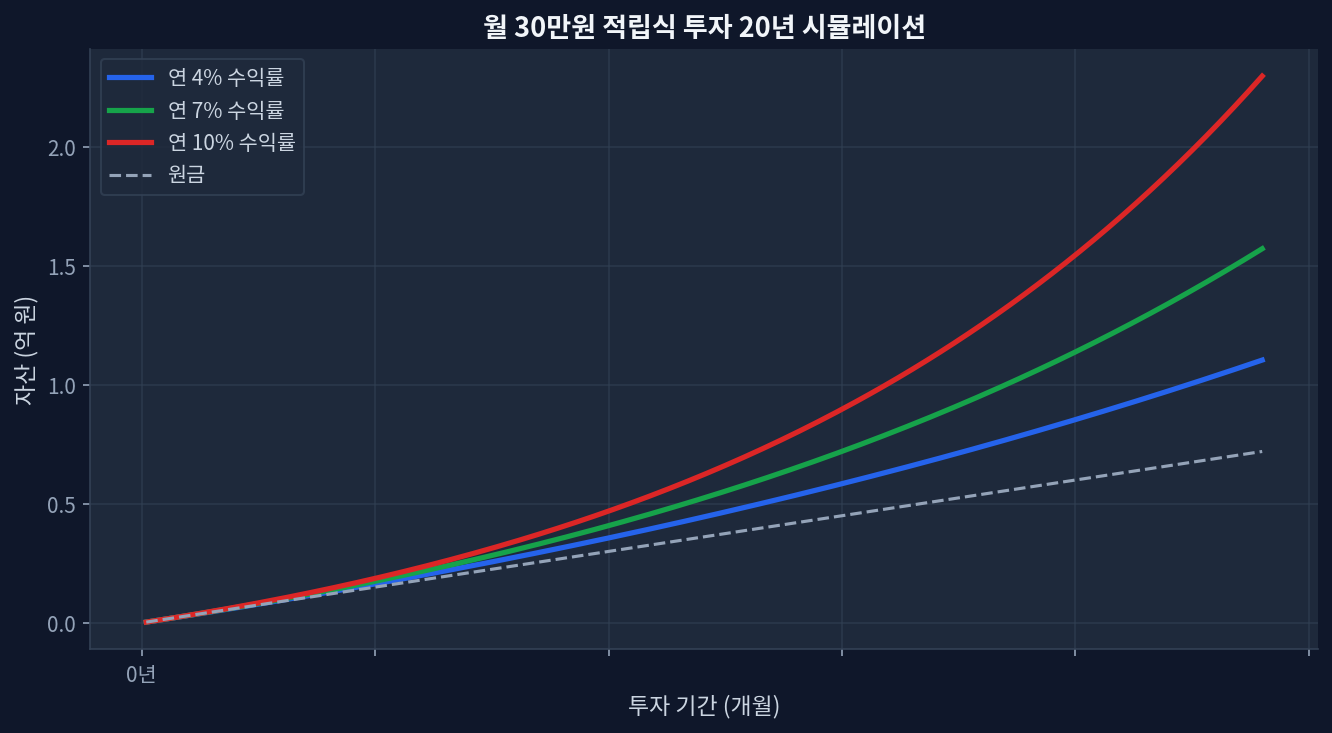
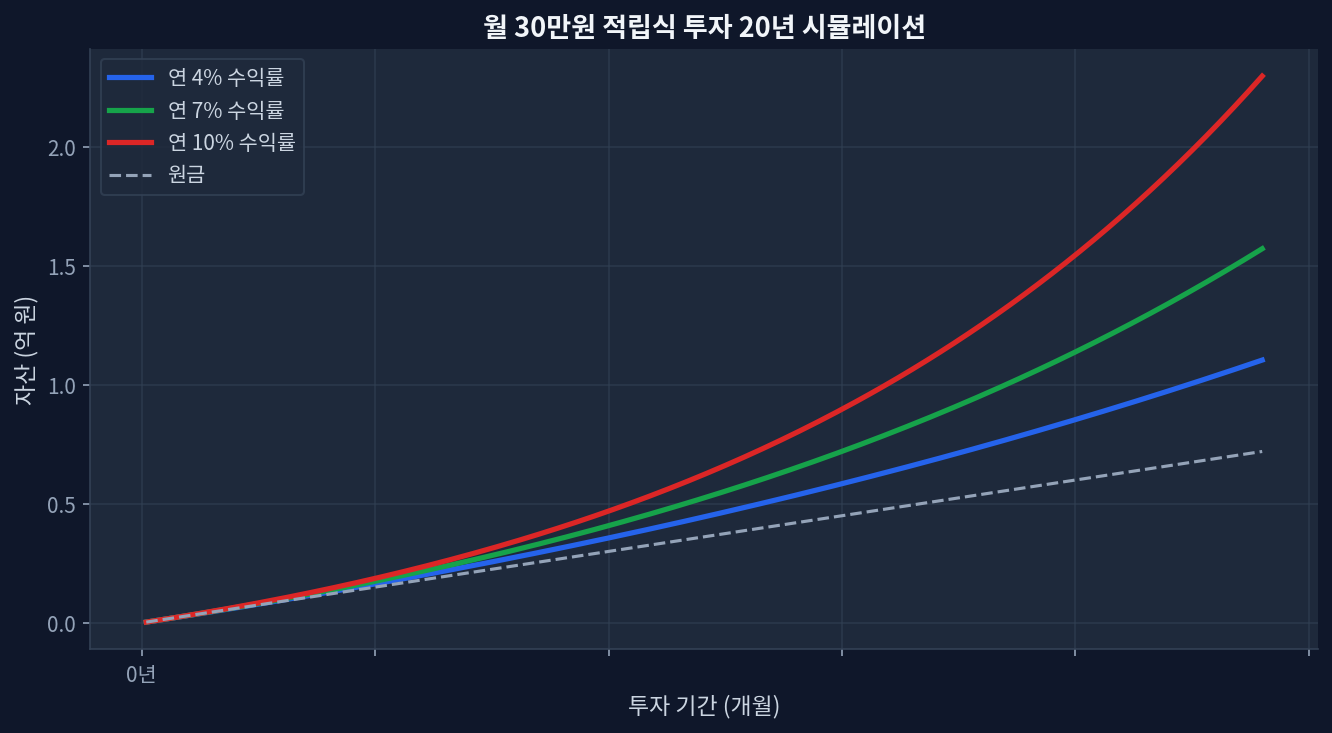
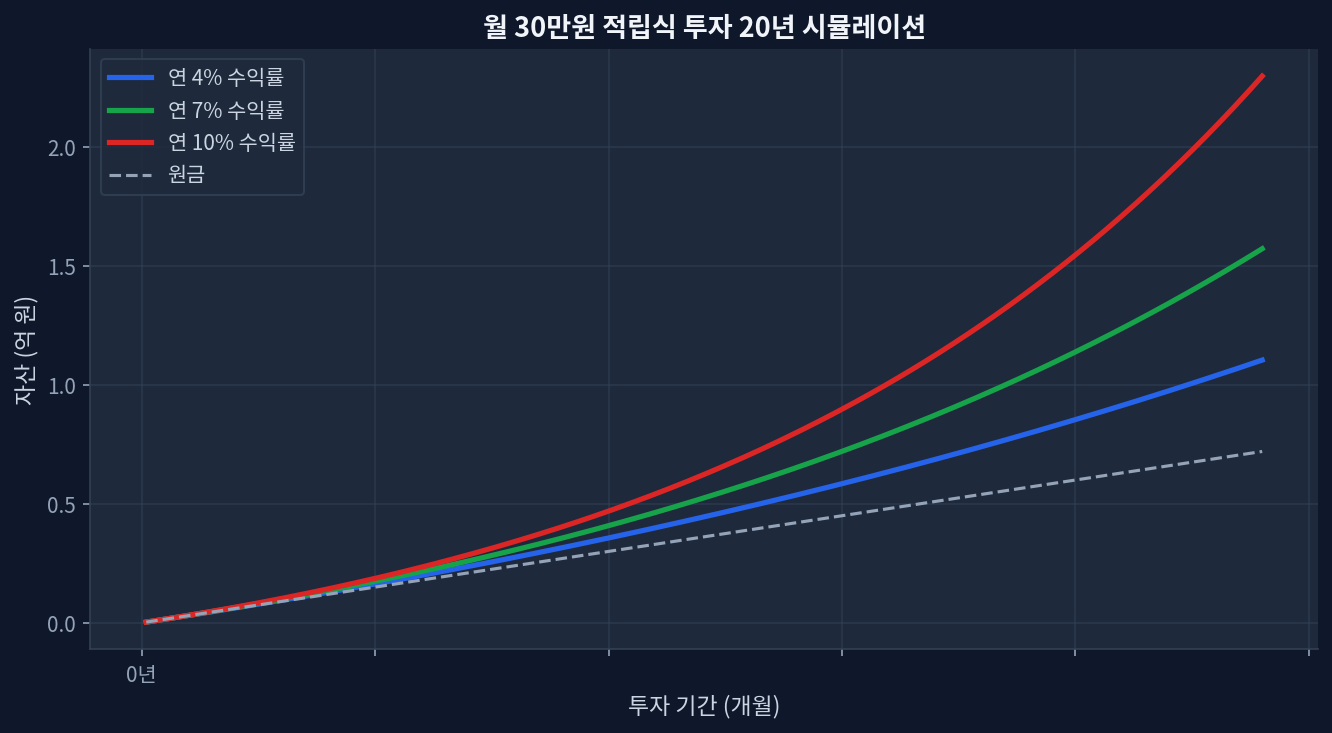
$1,500/month at 7% DRIP CAGR over 20 years = ~$782K; at 4%, ~$550K — a $232K gap driven entirely by the assumed return rateEvery 1% shift in assumed return adds or removes ~$110K–$130K in terminal value at year 20; sensitivity is nonlinearTax drag in taxable accounts reduces effective reinvestment yield by 15–25%; account type is a primary, not secondary, variable2020 S&P dividend cuts (~14% aggregate quarterly reduction) pushed realized DRIP rates 200bps below model assumptions for high-yield ETFsDRIP reinvestors during the Q1 2020 drawdown outperformed non-reinvestors by 12–18% by year-end — a volatility effect flat-line models ignore entirely What the 20-Year Simulation Data Actually Shows Monthly $30K investment 20-year compound growth simulation Running $1,500/month at 4%, 7%, and 10% for 20 years produces a divergence that widens sharply in the back half of the period. At year 10, the gap between the 4% and 10% paths is roughly $200K. By year 20, that gap exceeds $590K. The simulation chart above captures the inflection clearly: the 10% curve breaks away from the 4% path around year 12, when accumulated DRIP dividends begin compounding on themselves at scale.[FRED] ...

May 17, 2026 · InvestIQs Research