QQQ vs SPY 10-Year Regression: Tech Concentration vs Diversification

QQQ vs SPY 10-Year Regression: Tech Concentration vs Diversification

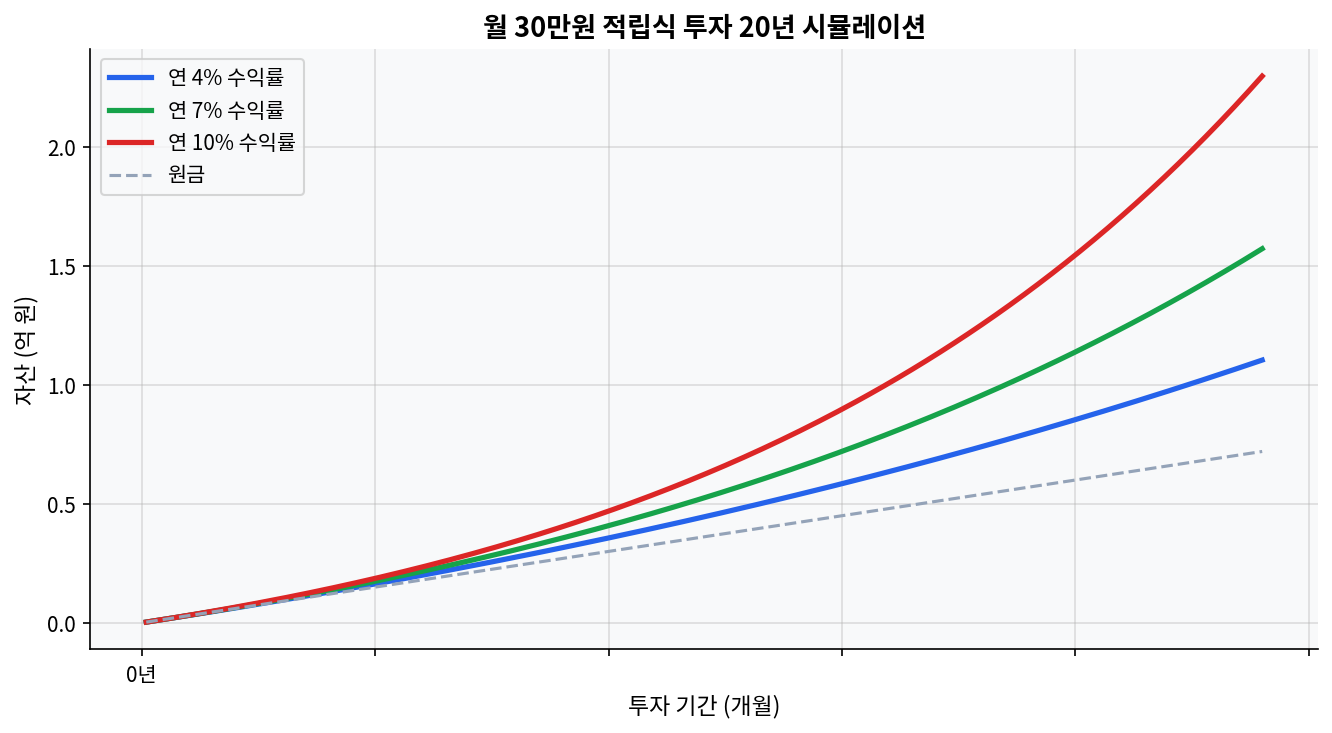
QQQ sits at $651.42 with a 1-year return of +44.0%, while SPY sits at $708.45 with a 1-year return of +33.8%.The 3-year cumulative gap is 30.2 percentage points: QQQ at +108.0% versus SPY at +77.8%.The 5-year cumulative gap is 15.4 percentage points: QQQ at +98.1% versus SPY at +82.7%.SPY still pays more income, with a 1.04% dividend yield versus QQQ at 0.43%, or 2.4 times as much cash yield.On an implied 5-year CAGR basis, QQQ is roughly 14.6% and SPY roughly 12.8%, which means the spread exists, but it is not huge enough to ignore regime risk. Why the 20-year savings curve matters more than the share price Monthly investment 20-year compound growth simulation The first mistake in comparing QQQ and SPY is to stare at the price tags. QQQ at $651.42 and SPY at $708.45 look like two expensive symbols, but share price is not the signal. The return path is. The 20-year monthly 300,000-won simulation inserted below this section makes the same point in a cleaner way: at 4%, 7%, and 10%, the ending values do not rise in a straight line. They accelerate. That is the compounding effect that turns a small annual edge into a large decade gap. ...
April 24, 2026
TQQQ Five-Year Drawdown and Volatility Decomposition: When 3x Trails 2x

TQQQ Five-Year Drawdown and Volatility Decomposition: When 3x Trails 2x

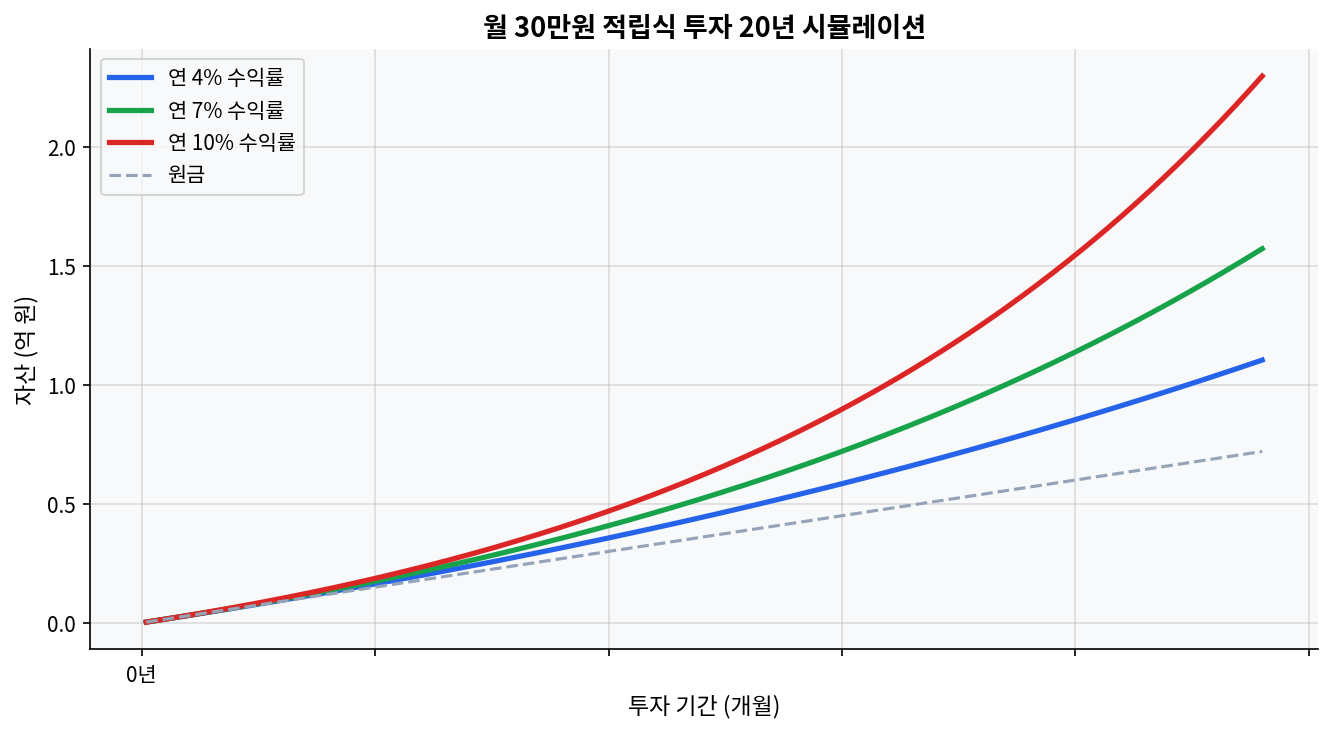
As of 2026-04-21, TQQQ’s 5-year total return was 120.40%, with a CAGR of 16.57%.As of 2026-03-31, TQQQ’s 5-year maximum drawdown was 81.65%, compared with 35.12% for QQQ.5-year annualized monthly volatility was 61.28% for TQQQ, 20.23% for QQQ, and 40.61% for QLD.Over the same 5-year window, QLD outperformed TQQQ with a total return of 137.48% and a CAGR of 18.77%.Dividend yield sat at 0.53% for TQQQ, 0.15% for QLD, and 0.43% for QQQ. For leveraged ETFs, the core driver is not cash flow but path dependency. The Two Charts Say the First Thing Comparison of how ETF fee differences affect long-term returns The first chart shows the long-run asset gap between 0.05% and 1.0% ETF fees over 20 years. The second shows how monthly $300 contributions diverge over time at 4%, 7%, and 10% annual returns. In the TQQQ discussion, those two charts are not background noise. For leveraged ETFs, cost and path shape the equity curve faster than the headline return table suggests. Even if TQQQ posts a strong 2020-2026 run, a single 2022-style collapse can damage the long-run profile in ways that are hard to reverse. ...

April 24, 2026
VOO DCA After 12 Months: Real Returns, Mistakes, and SCHD Contrast

VOO DCA After 12 Months: Real Returns, Mistakes, and SCHD Contrast

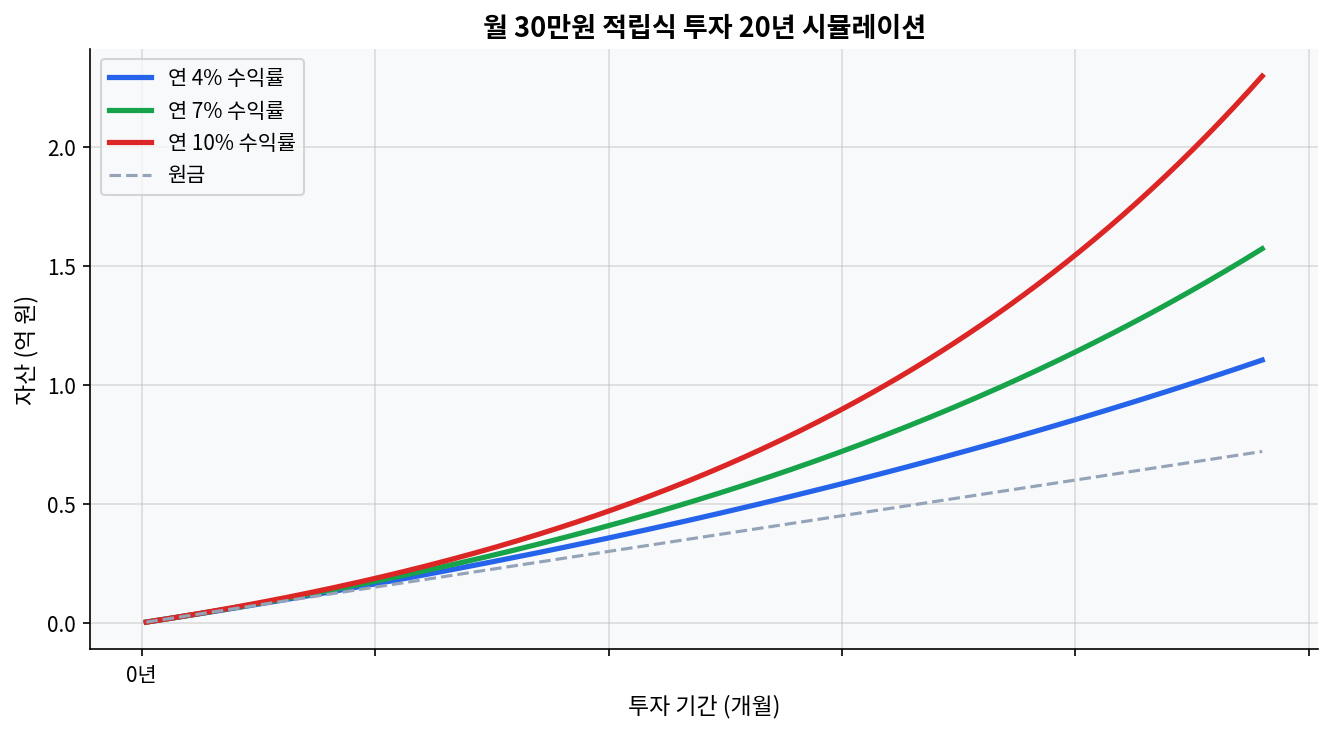
VOO sits at $651.54 with a 1-year return of +36.3%, a 3-year cumulative return of +79.0%, a 5-year cumulative return of +85.0%, and a dividend yield of 1.09%.SCHD sits at $31.03 with a 1-year return of +26.8%, a 3-year cumulative return of +41.5%, a 5-year cumulative return of +49.8%, and a dividend yield of 3.4%.Across the provided windows, VOO beat SCHD by 9.5 percentage points over 1 year, 37.5 points over 3 years, and 35.2 points over 5 years on cumulative return.The chart below tests monthly KRW 300,000 DCA over 20 years at 4%, 7%, and 10%; the gap between those paths shows how sensitive long-horizon outcomes are to small return differences.The biggest mistake in a first-year DCA window is treating a strong 12-month run as a permanent feature of the market instead of a regime that can change fast. What the 20-year DCA chart is really saying Monthly investment 20-year compound growth simulation The chart beneath this section is the cleanest reminder that monthly ETF investing is about time, not drama. A monthly KRW 300,000 plan over 20 years looks modest in year 1, then starts to separate sharply when the assumed return moves from 4% to 7%, and again from 7% to 10%. That is the core lesson. The later contributions matter less than the early contributions once compounding starts doing real work. ...

April 22, 2026