SCHD Dividend Cut -2.7% Maintains 3.25% Yield: Strategic Positioning B
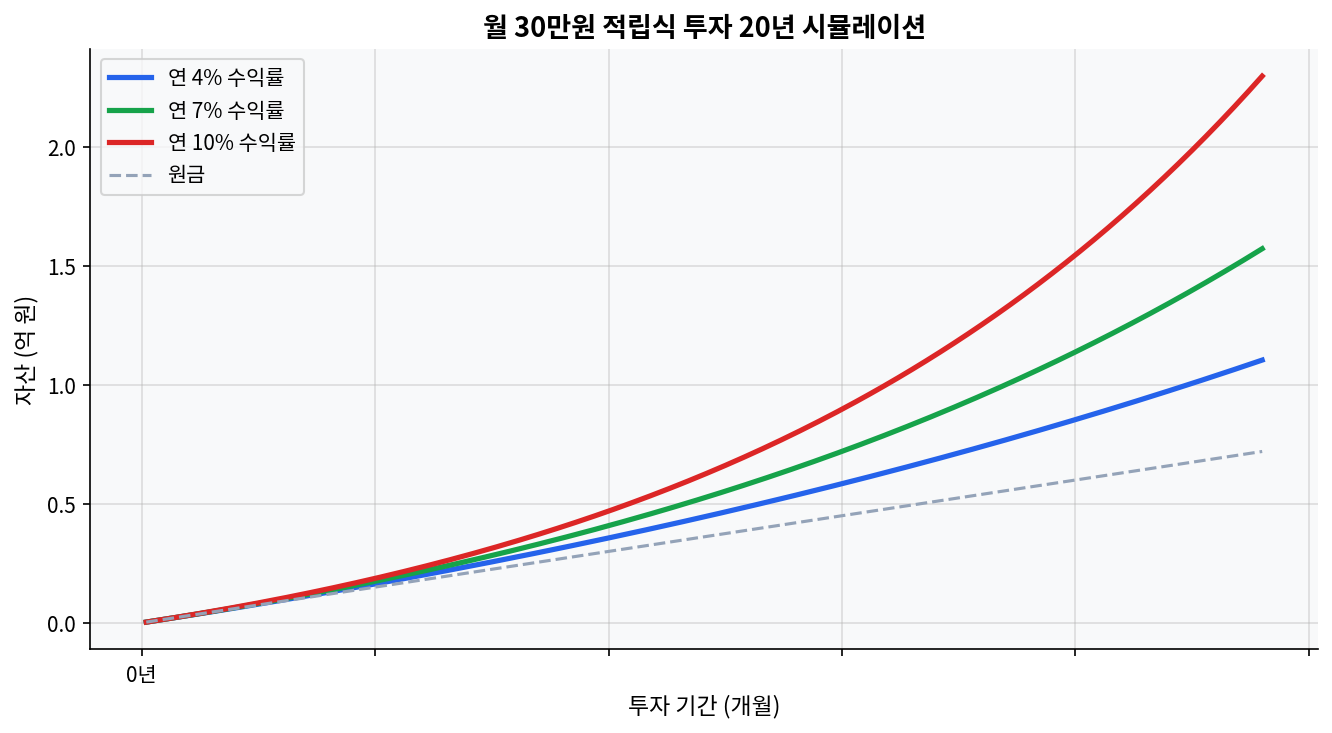
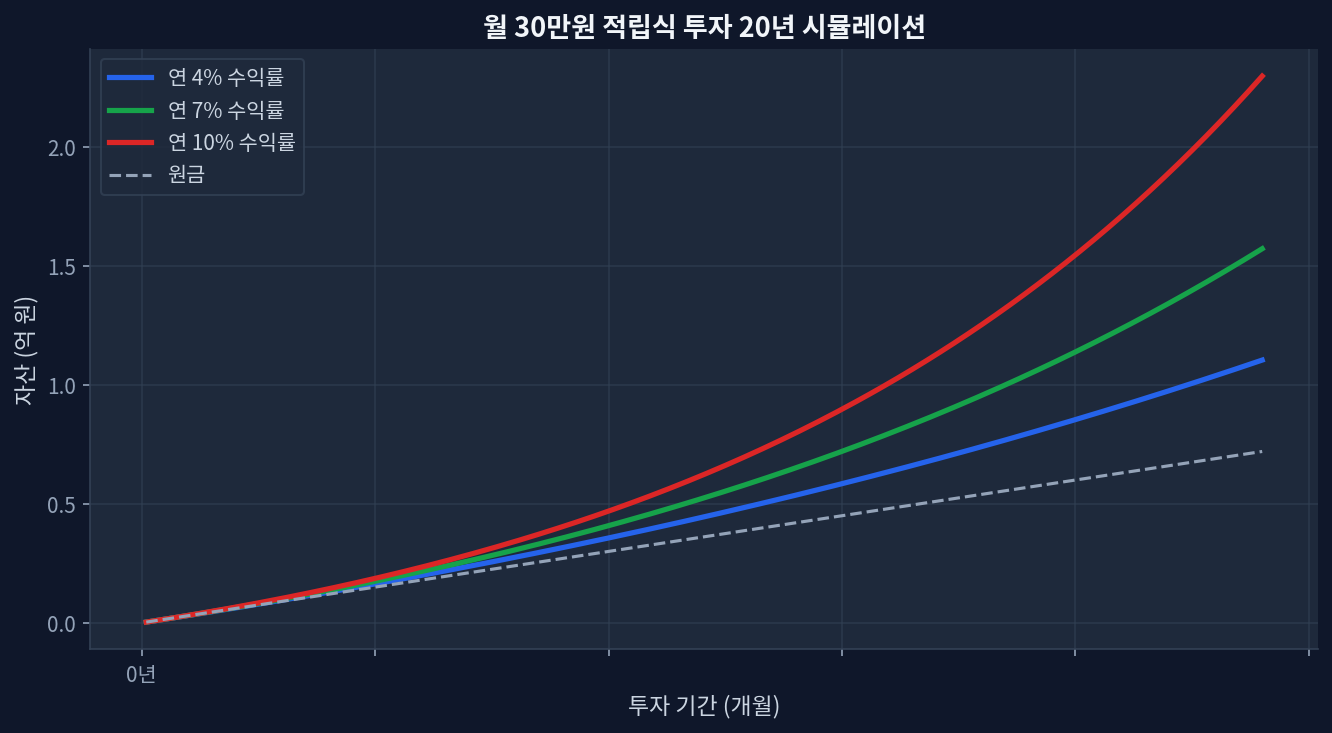
SCHD Quarterly Dividend Cut -2.7% Maintains 3.25% Yield: Strategic Positioning Beyond the Headline Monthly $30K investment 20-year compound growth simulation SCHD quarterly dividend: $0.2530, down -2.7% year-over-year Dividend yield: Still 3.25% — 2.2x higher than VIG's 1.47% 1-year total return: +26.5% (dividends plus price appreciation) Current valuation: P/E 18.8 reflects moderate pricing; near 52-week high at 85.7% percentile Assets under management: $94.9B — scale supporting dividend stability Dividend Reduction: Why It Does Not Signal Distress 20-Year Compounding Simulation: Monthly Dollar-Cost Averaging Strategy Schwab US Dividend Equity ETF (SCHD) announced a quarterly dividend of $0.2530, representing a -2.7% reduction from $0.2600 in the same quarter of 2024. On surface-level headlines, this reads negative — dividends declined. ...