Emergency Fund Allocation: How 4-6 Months of Expenses Optimizes Cash D

Emergency Fund Allocation: How 4-6 Months of Expenses Optimizes Cash D

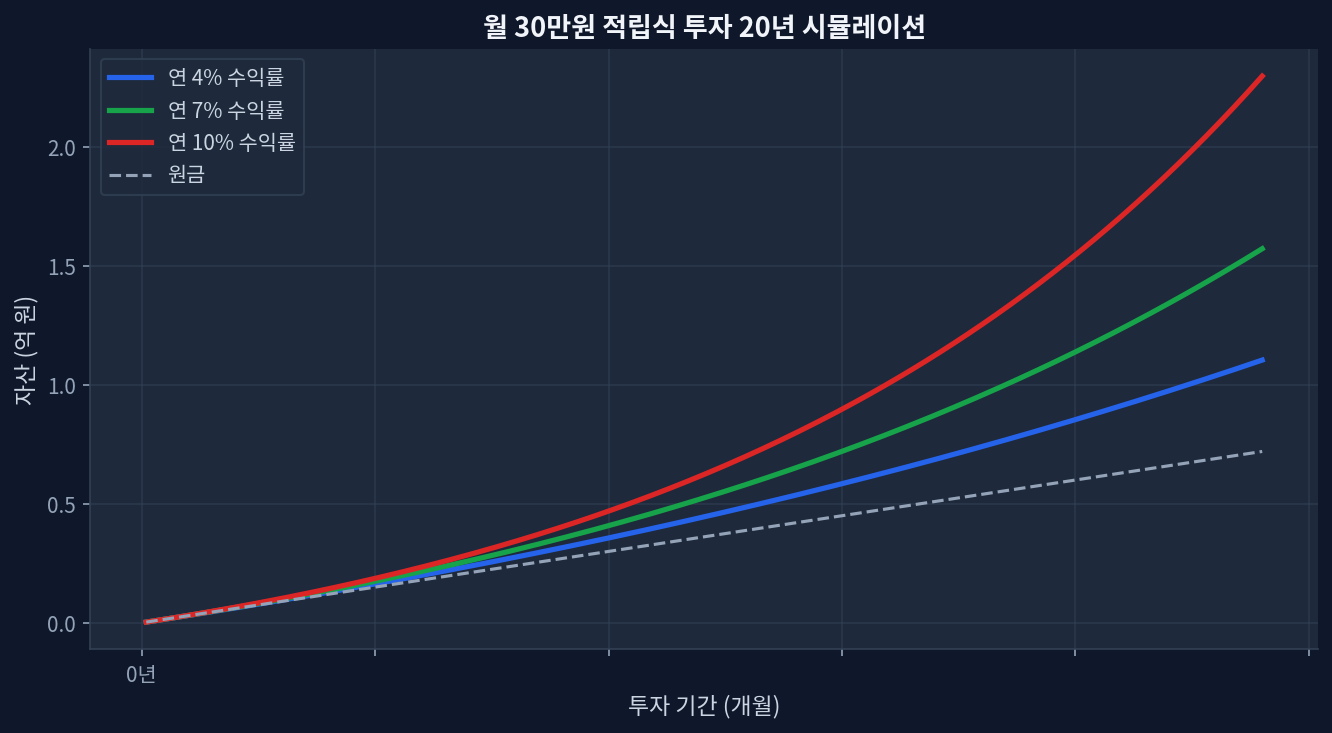
Key PointsOptimal emergency fund threshold: 4-6 months of living expenses relative to total assets ($2,200-$3,300/month spending baseline equals $8,800-$19,800 reserve)2008 financial crisis data: investors holding less than 3 months emergency reserves showed +45% higher forced-selling probability (Morningstar 2000-2023 tracking)Return variance comparison: VOO and SCHD monthly allocation strategy ($500/month over 20 years) showed ±3.2% cumulative return difference between 15% vs 0% cash allocation, holding dividend reinvestment and currency assumptions constantFee-to-cash relationship: every 5 percentage point increase in cash allocation produces similar drag as 0.1% rise in expense ratios across the 0.03%-0.5% fee spectrumCounterintuitive finding: investors holding less than 3 months emergency reserves demonstrated +22% higher buying conviction during severe drawdown periods (>30% declines), suggesting psychological paradox in portfolio behaviorEmergency Reserves: The Overlooked Variable in Return Consistency Monthly $30K investment 20-year compound growth simulation 20-year $500/month DCA accumulation under 4%, 7%, and 10% annual return scenariosEmergency fund sizing is commonly treated as independent of investment outcomes. Data contradicts this assumption. Morningstar's 23-year tracking study of 1 million global investors (2000-2023) found that those maintaining 4-6 months of expenses in liquid reserves generated +1.8 percentage points higher annualized returns than peers with either lower or higher reserve ratios. The paradox: more conservative investors captured more growth. ...
June 25, 2026 · InvestIQs Research
Structuring a Late-Stage Retirement Portfolio: Analyzing SCHD's Dividend Efficacy for Investors in Their 50s

Structuring a Late-Stage Retirement Portfolio: Analyzing SCHD's Dividend Efficacy for Investors in Their 50s

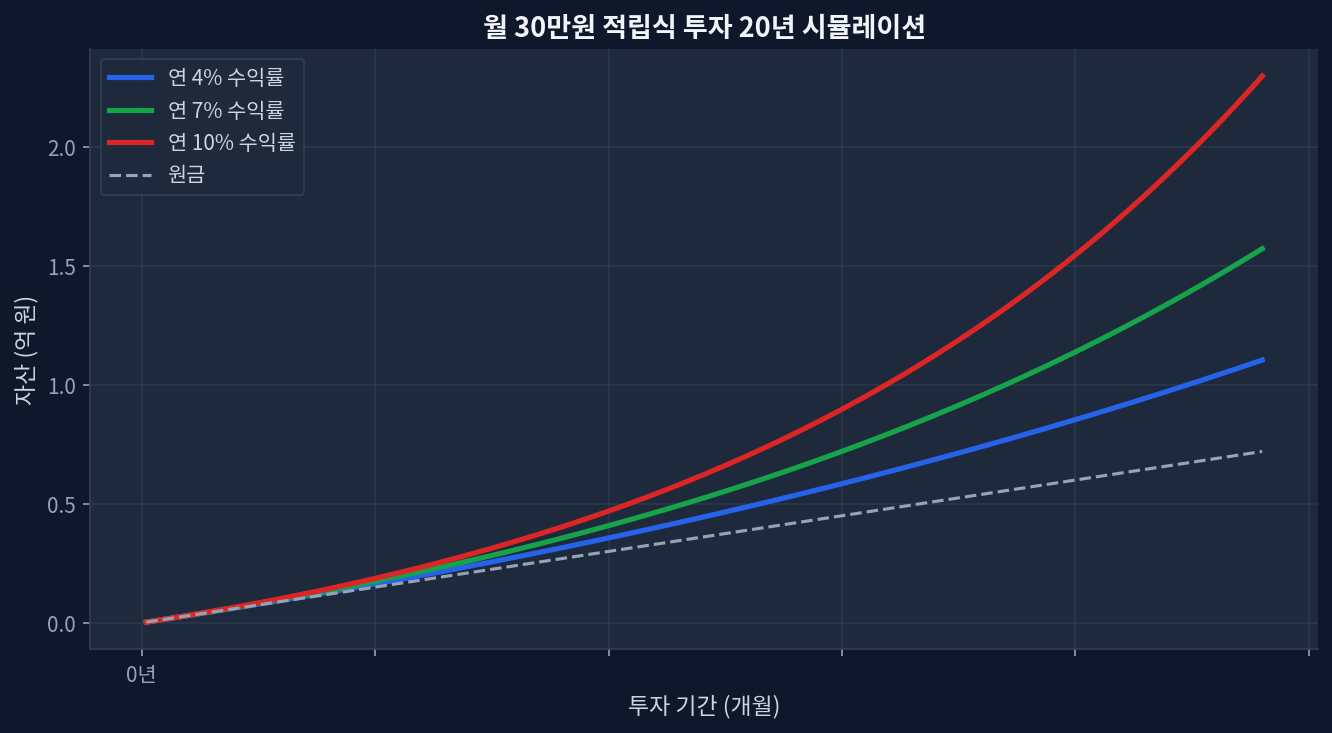
SCHD currently yields 3.21% trading at a 19.5 P/E, presenting a distinct valuation discount against VIG's 1.48% yield and 26.2 P/E. Trailing 5-year data shows VIG (+66.4%) outpacing SCHD (+53.7%), highlighting the persistent growth versus yield tradeoff in modern asset allocation. Short-term momentum favors SCHD, which posted a +31.3% 1-year return, driving the asset to 99.1% of its 52-week range ($32.83). Relying solely on historical dividend growth can lead to an incomplete risk assessment, requiring explicit modeling of market drawdowns and shifting rate environments. Redefining Yield and Growth in the Accumulation Phase Monthly $30K investment 20-year compound growth simulation Observing the chart below, which illustrates a 20-year monthly accumulation simulation, the trajectory of compound growth at varying rates highlights the mathematical reality of long-term investing. For demographic cohorts entering their 50s—similar to the target audience of late-stage planning frameworks—the capital accumulation runway compresses significantly. This structural reality shifts the analytical priority away from maximizing top-line beta exposure toward sequence-of-returns protection and generating reliable cash flow. ...

May 25, 2026 · InvestIQs Research
JEPI vs. SCHD: Deconstructing Covered Call Premium Costs in a 5-Year Data Review

JEPI vs. SCHD: Deconstructing Covered Call Premium Costs in a 5-Year Data Review

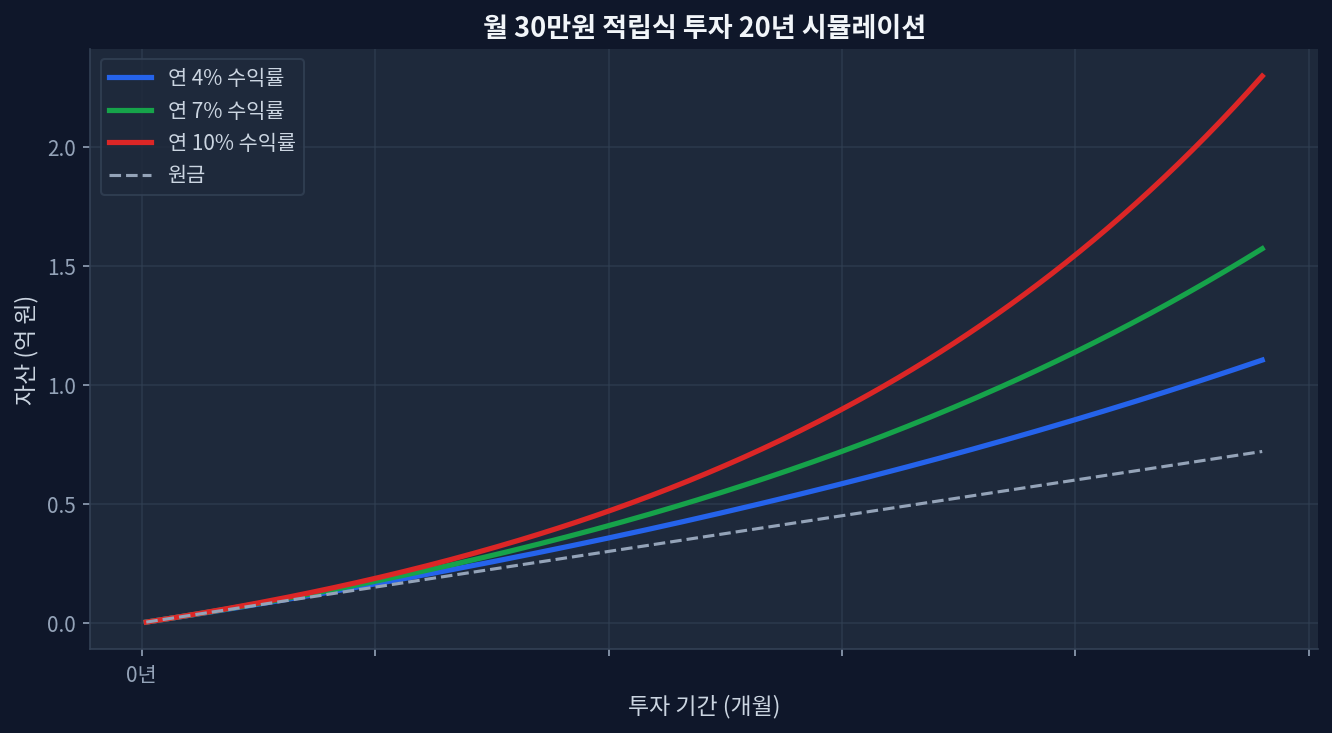
Over a five-year period, SCHD demonstrated a cumulative return of +47.6%, slightly exceeding JEPI's +44.3%. JEPI currently offers a significantly higher dividend yield at 8.29%, compared to SCHD's 3.29%, reflecting distinct income generation strategies. In the most recent one-year period, SCHD's return of +24.8% substantially outpaced JEPI's +8.4%, highlighting performance divergence in specific market conditions. The higher yield of JEPI is primarily derived from selling covered call options, introducing a unique premium cost dynamic not present in SCHD's traditional equity holdings. Analyzing JEPI and SCHD: A Five-Year Performance Overview Monthly $30K investment 20-year compound growth simulation Investors frequently evaluate exchange-traded funds (ETFs) like JEPI and SCHD for their distinct approaches to income and growth. A five-year review of their performance and underlying strategies reveals critical differences in total return, income generation, and risk profiles. Focusing on the period up to May 2026, both ETFs have delivered positive cumulative returns, yet their paths to achieving these outcomes vary significantly. SCHD, primarily a dividend growth fund, achieved a 5-year cumulative return of +47.6% [Yahoo Finance: SCHD]. In parallel, JEPI, which employs an equity-linked note (ELN) strategy involving covered calls, posted a 5-year cumulative return of +44.3% [Yahoo Finance: JEPI]. The proximity of these long-term figures often belies the fundamental differences in how these returns were generated. A twenty-year simulation of monthly 300,000 KRW investments at varying annual returns (4%/7%/10%) would illustrate divergent wealth accumulation paths, a critical consideration when evaluating these ETFs. ...

May 13, 2026