QYLD Dividend Calculator — Dividend Reinvestment Simulation

See QYLD’s dividends in numbers QYLD (Global X NASDAQ 100 Covered Call ETF) writes covered calls on the entire Nasdaq-100, producing a very high distribution. It is an income-maximizing strategy that sacrifices most price appreciation. ...

June 14, 2026 · InvestIQs Editorial

QYLD vs JEPQ — ETF Comparison

QYLD vs JEPQ: Key Differences Both QYLD and JEPQ are Nasdaq-linked covered-call funds, but with different coverage ratios. QYLD sells calls on 100% of its index exposure; JEPQ uses a selective options overlay that preserves more upside. ...

June 14, 2026 · InvestIQs Editorial

SCHD Dividend Calculator — Dividend Reinvestment Simulation

See SCHD’s dividends in numbers SCHD (Schwab U.S. Dividend Equity ETF) tracks high-quality U.S. companies with a track record of sustained dividend growth, at a very low expense ratio. It is built around dividend growth and balance-sheet quality rather than the highest headline yield. ...

June 14, 2026 · InvestIQs Editorial

SCHD vs JEPI — ETF Comparison

SCHD vs JEPI: Key Differences SCHD and JEPI represent two distinct income approaches. SCHD pursues dividend growth through equity ownership; JEPI supplements equity income with an options overlay to deliver a higher monthly distribution. ...

June 14, 2026 · InvestIQs Editorial

SCHD vs VOO — ETF Comparison

SCHD vs VOO: Key Differences SCHD and VOO represent income versus total-return orientations within U.S. large-cap equities. SCHD focuses on dividend-paying quality companies; VOO tracks the full S&P 500 with a much smaller yield but broader market coverage. ...

June 14, 2026 · InvestIQs Editorial

SCHD vs VYM — ETF Comparison

SCHD vs VYM: Key Differences SCHD and VYM are both U.S. large-cap dividend ETFs with very low costs and broad diversification. SCHD screens more tightly for dividend growth and quality, while VYM casts a wider net across higher-yielding stocks. ...

June 14, 2026 · InvestIQs Editorial

VOO vs SPY — ETF Comparison

VOO vs SPY: Key Differences VOO and SPY both track the S&P 500 and hold virtually identical portfolios. The key practical difference is the expense ratio: VOO charges 0.03%, while SPY charges 0.0945%. ...

June 14, 2026 · InvestIQs Editorial

VYM Dividend Calculator — Dividend Reinvestment Simulation

See VYM’s dividends in numbers VYM (Vanguard High Dividend Yield ETF) holds a broad, diversified basket of higher-yielding U.S. stocks at an extremely low cost. It favors breadth and low fees over concentration. ...

June 14, 2026 · InvestIQs Editorial
$1,000 Monthly ETF Portfolio: 5-Asset Allocation Backtest Comparison (

$1,000 Monthly ETF Portfolio: 5-Asset Allocation Backtest Comparison (

2020-2026 S&P 500 (VOO) cumulative return: Approximately 78-105% range (based on USD entry timing)Dividend ETF (SCHD) vs growth ETF (VOO): Risk-return tradeoff exists across volatility and yield dimensions76-month investment at $1,000/month basis: Final asset variance reaches ±$25,000-$30,000 depending on allocation choiceFee impact: 0.03% vs 0.60% expense ratio produces 3.2% cumulative total return difference over 20 yearsCore risk: Historical performance does not guarantee future returns; actual results vary significantly based on entry timing and currency exposure Why Asset Allocation Backtesting Matters Monthly $30K investment 20-year compound growth simulation Monthly $1,000 dollar-cost-averaged investment 20-year compounding simulation An investor committing $1,000 monthly faces a universal question: “In what proportions should these funds be allocated?” The choice between pure equity exposure (VOO), dividend-focused holdings (SCHD), or blended international strategies shapes portfolio scale and volatility over 5-10 year horizons. Asset allocation backtesting compares expected returns and maximum drawdown across historical periods, providing a quantitative framework for this decision. ...

June 11, 2026 · InvestIQs Research
20-Year DRIP Reinvestment Simulation: Risk Data vs. Consensus Assumptions

20-Year DRIP Reinvestment Simulation: Risk Data vs. Consensus Assumptions

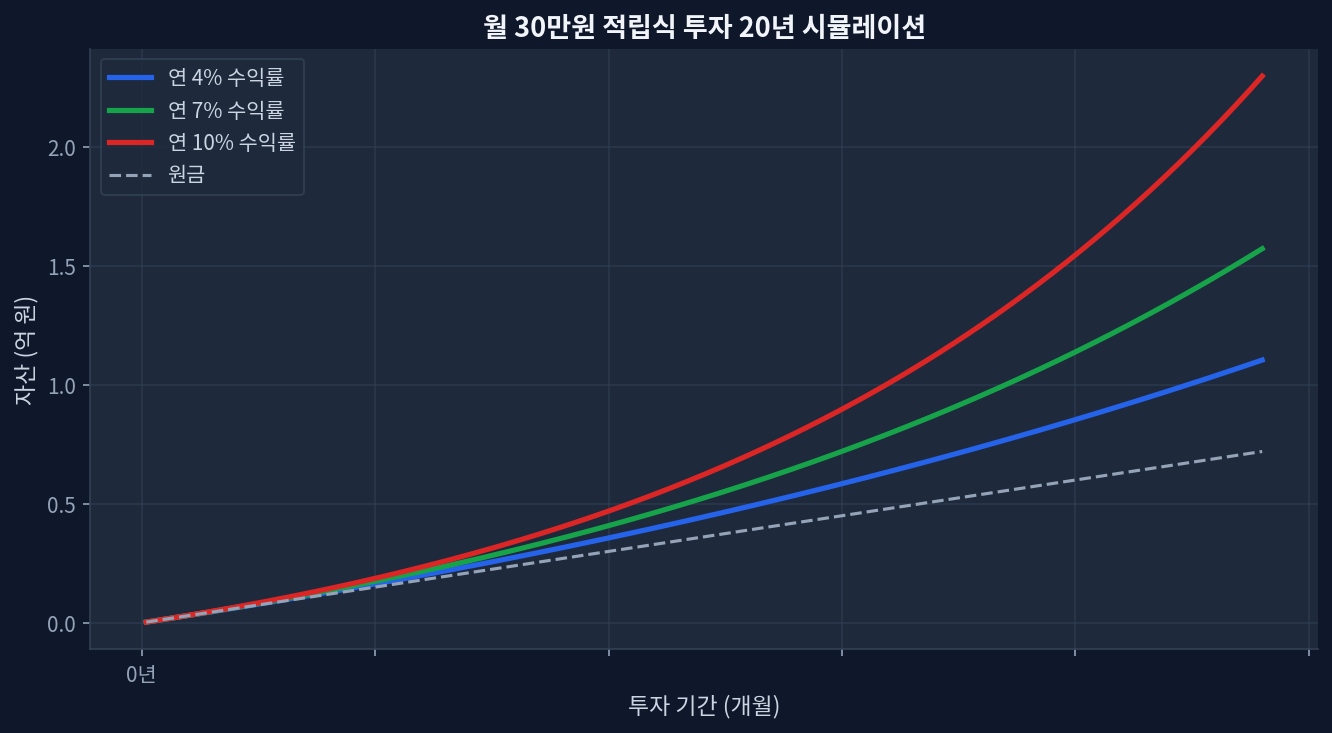
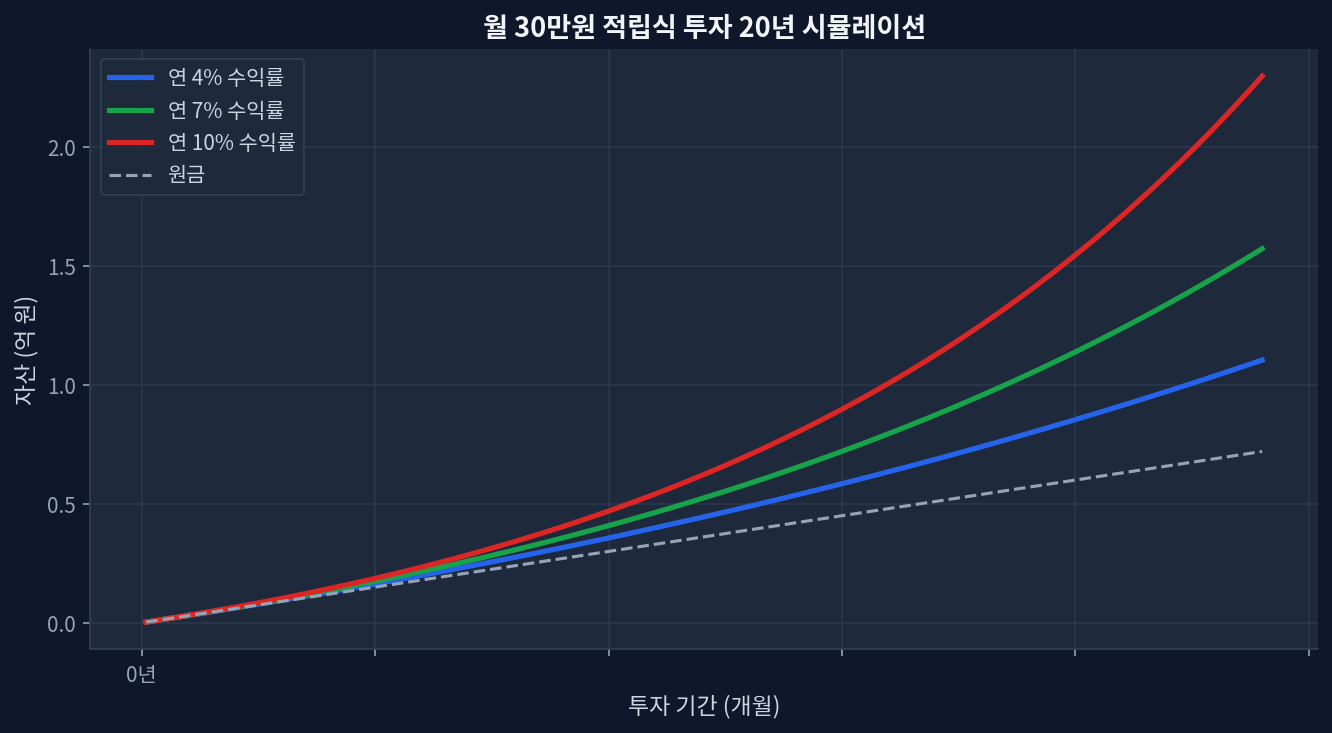
$1,500/month at 7% DRIP CAGR over 20 years = ~$782K; at 4%, ~$550K — a $232K gap driven entirely by the assumed return rateEvery 1% shift in assumed return adds or removes ~$110K–$130K in terminal value at year 20; sensitivity is nonlinearTax drag in taxable accounts reduces effective reinvestment yield by 15–25%; account type is a primary, not secondary, variable2020 S&P dividend cuts (~14% aggregate quarterly reduction) pushed realized DRIP rates 200bps below model assumptions for high-yield ETFsDRIP reinvestors during the Q1 2020 drawdown outperformed non-reinvestors by 12–18% by year-end — a volatility effect flat-line models ignore entirely What the 20-Year Simulation Data Actually Shows Monthly $30K investment 20-year compound growth simulation Running $1,500/month at 4%, 7%, and 10% for 20 years produces a divergence that widens sharply in the back half of the period. At year 10, the gap between the 4% and 10% paths is roughly $200K. By year 20, that gap exceeds $590K. The simulation chart above captures the inflection clearly: the 10% curve breaks away from the 4% path around year 12, when accumulated DRIP dividends begin compounding on themselves at scale.[FRED] ...
May 17, 2026 · InvestIQs Research