JEPI Quarterly Dividend Raised 10.3%, Yet Growth Stagnation Signals Ca

JEPI Quarterly Dividend Raised 10.3%, Yet Growth Stagnation Signals Ca

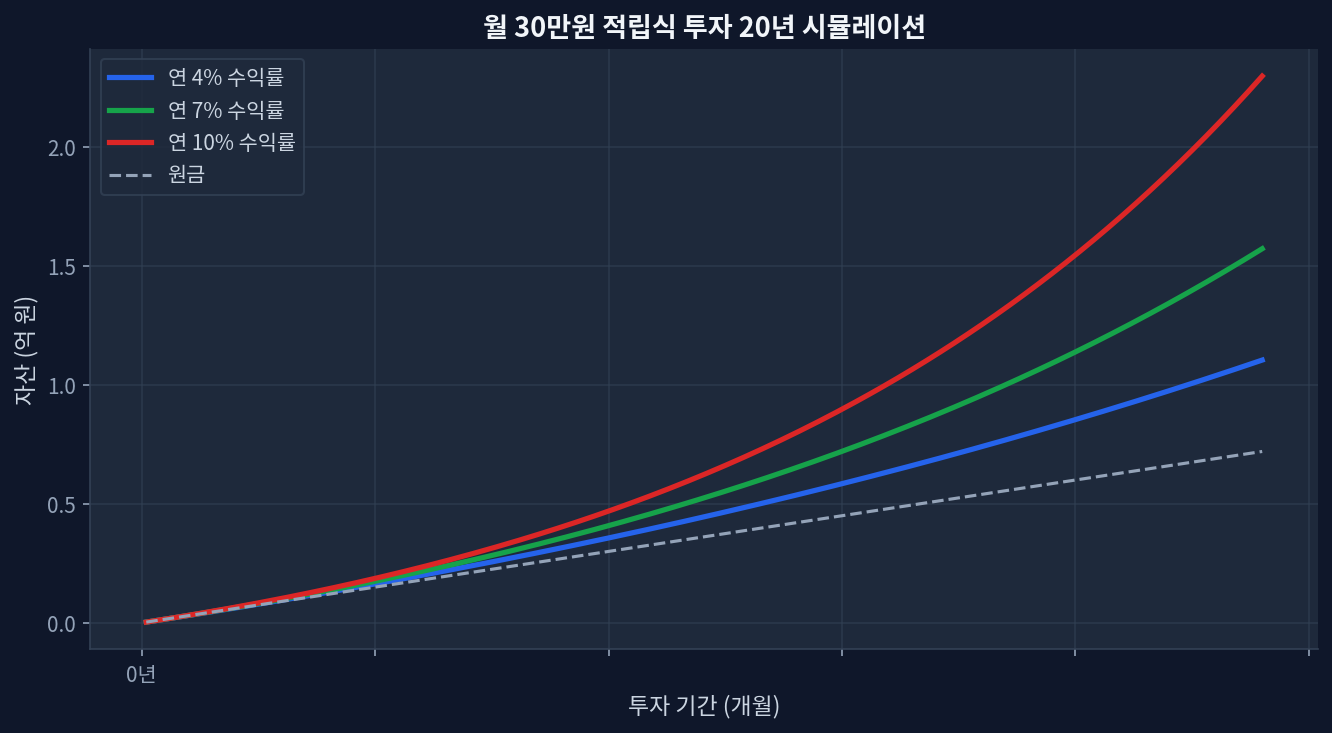
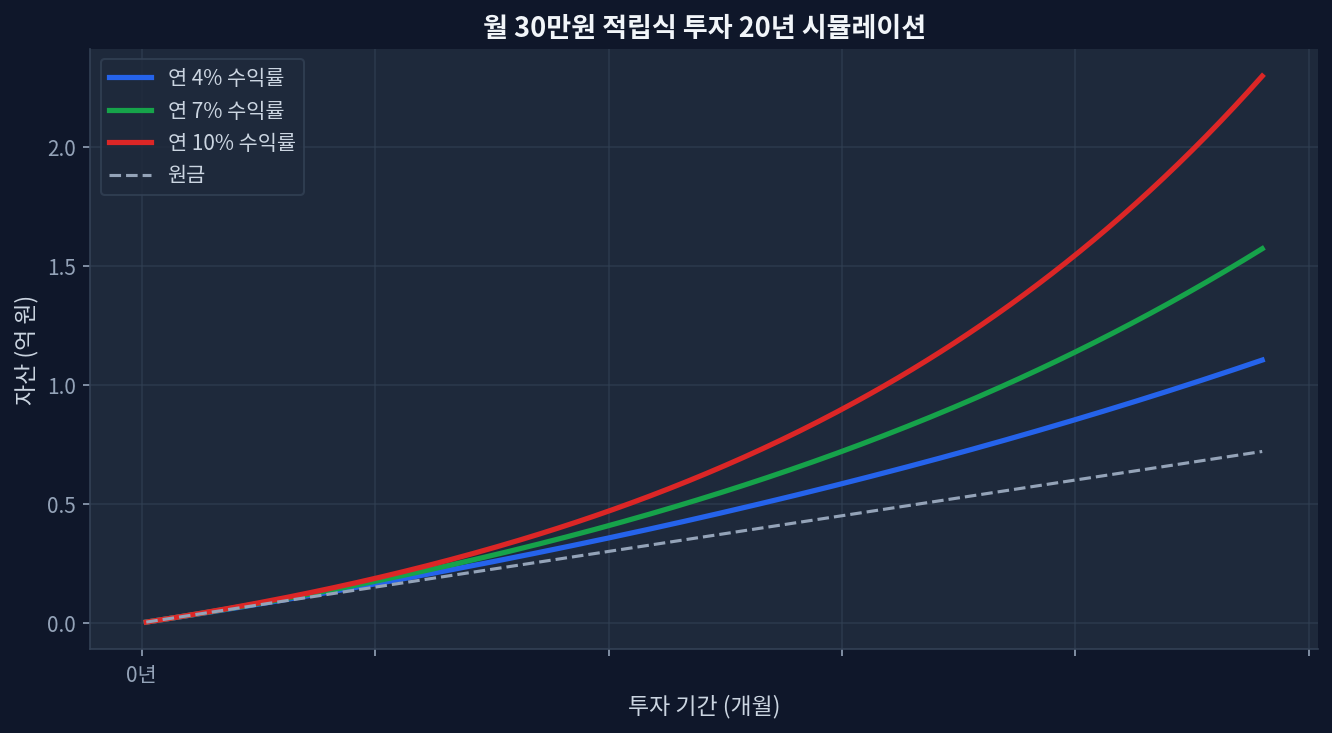
schd-deconstructing-covered-call-premium-costs-in-a-5-year-data-review/">JEPI quarterly dividend announcement: $0.3870 (+10.3% year-over-year increase)Current dividend yield: 8.08% (elevated) vs. 1-year total return: +7.4% (weak)5-year cumulative return: +42.5% vs. SCHD +54.9% (2.4% annualized gap)P/E ratio 26.8 (40% premium to SCHD's 19.0); trading at 30.2% of 52-week range (bearish signal)Cash outflow pressure: elevated dividend payments reduce retained capital, weakening share price defense The Structural Dilemma Hidden in Dividend Growth Monthly $30K investment 20-year compound growth simulation Monthly $2,000 Recurring Investment Over 20 Years: Compound Growth Simulation JEPI’s quarterly dividend increase to $0.3870 appears favorable on the surface. A 10.3% jump from the prior-year quarter’s $0.3508 demonstrates consistency. Yet for a $44.7 billion ETF to draw attention primarily on dividend growth itself represents a structural problem. ...
July 19, 2026 · InvestIQs Research
SCHD Quarterly Dividend Cut 2.7%, Yet 3.25% Yield Persists: Why the Ma

SCHD Quarterly Dividend Cut 2.7%, Yet 3.25% Yield Persists: Why the Ma

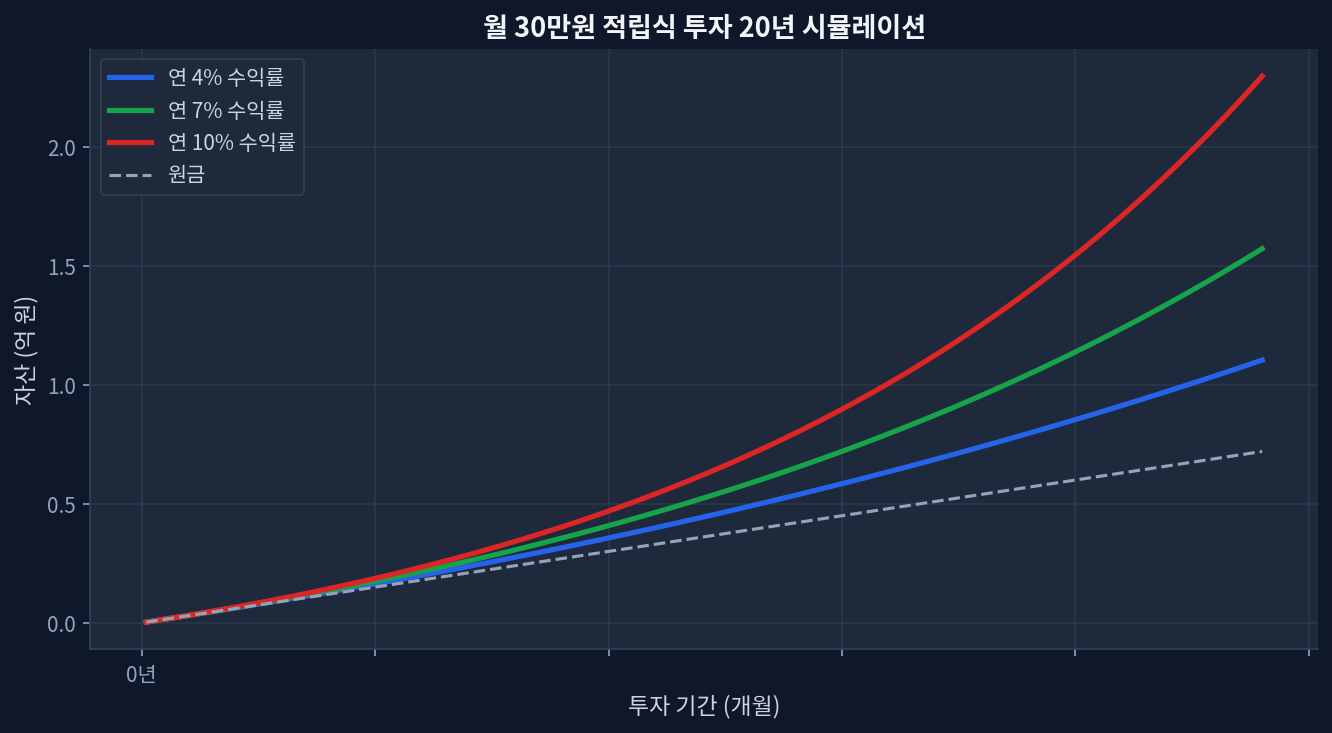
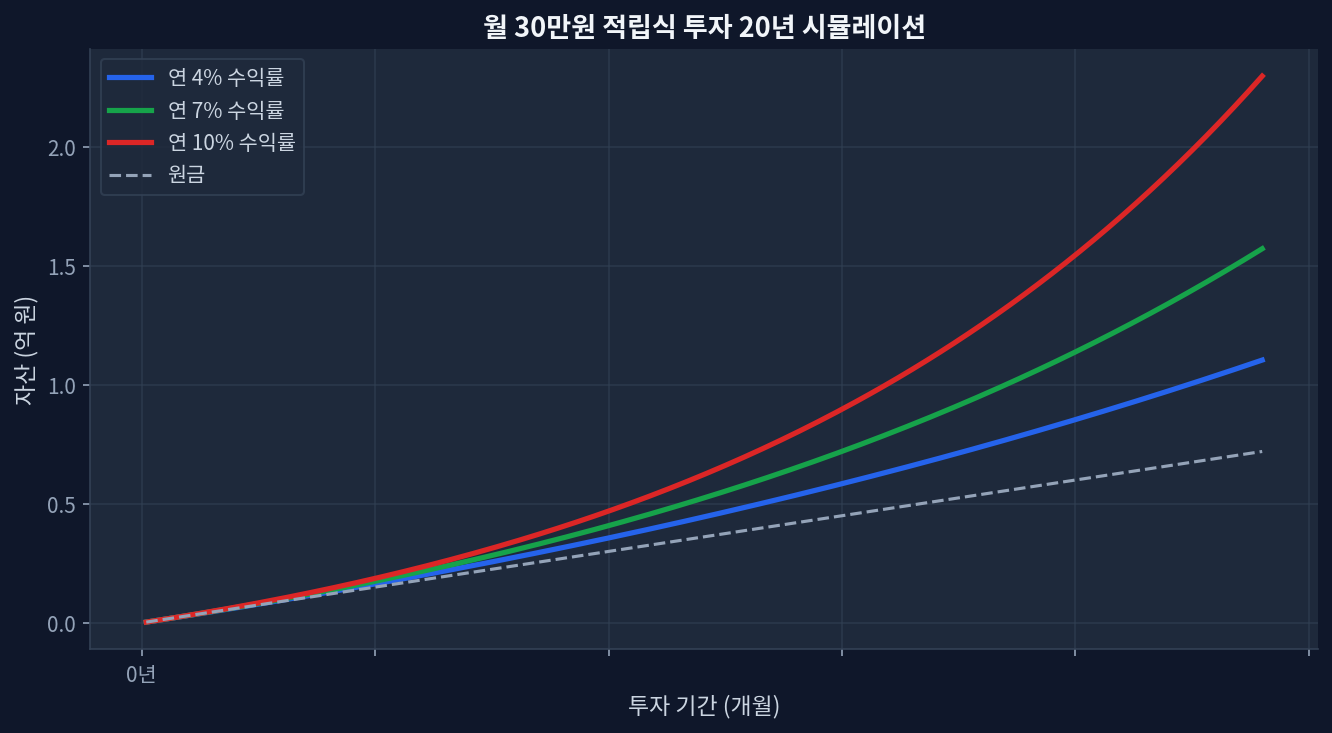
SCHD Quarterly Dividend Cut 2.7%, Yet 3.25% Yield Persists: Why the Market Narrative Misses the Point Monthly $30K investment 20-year compound growth simulation SCHD quarterly dividend: $0.2530, down 2.7% year-over-year Dividend yield: Still 3.25% — 2.2x higher than VIG at 1.47% One-year total return: +26.5% (dividend plus capital appreciation) Current valuation: P/E 18.8, moderate territory, currently trading 85.7% into the 52-week range Assets under management: $94.9B — scale that underpins distribution stability Dividend Cut, Yet Surprisingly Resilient Schwab US Dividend Equity ETF (SCHD) announced a quarterly distribution of $0.2530—down 2.7% from the same period last year at $0.2600. On the surface, a contraction in cash flow. Dividend was trimmed, so the narrative should be negative. ...

July 1, 2026 · InvestIQs Research
SCHD Dividend Cut of -2.7% Yet Yield Holds at 3.25%: Dividend Stabilit

SCHD Dividend Cut of -2.7% Yet Yield Holds at 3.25%: Dividend Stabilit

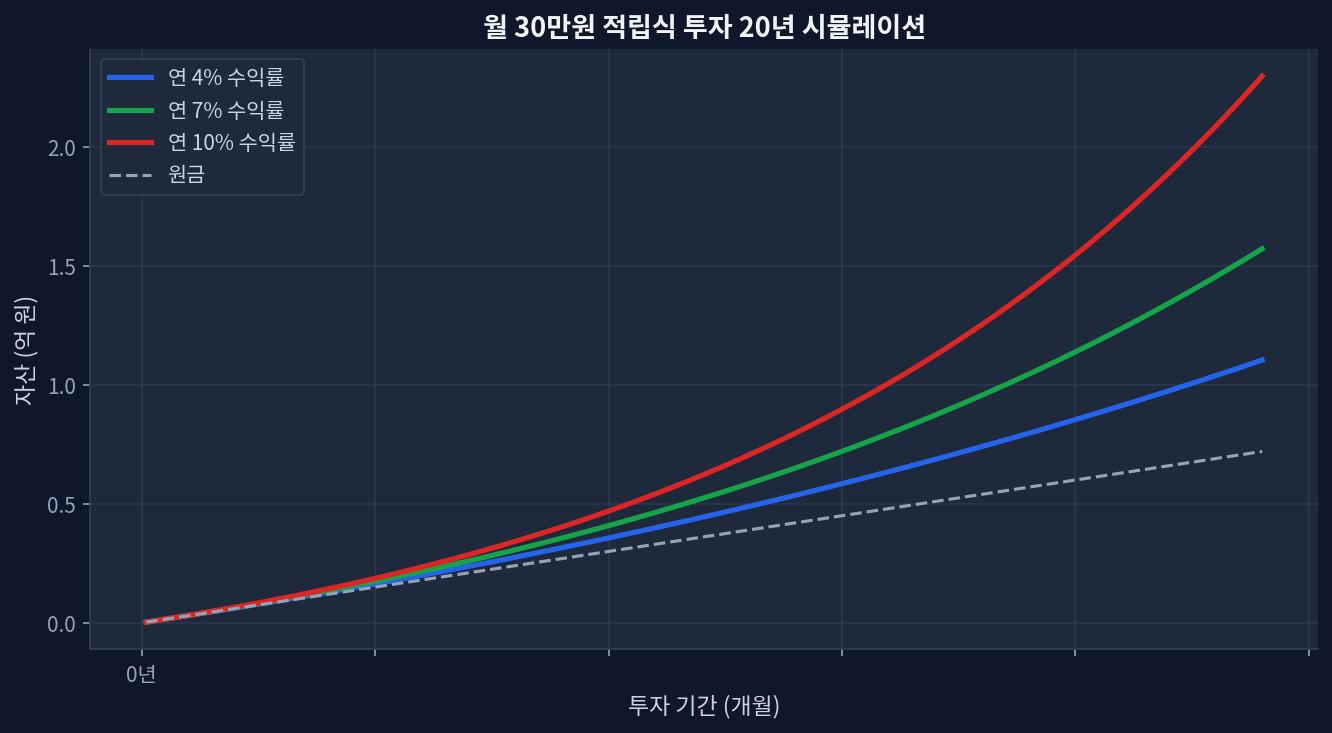
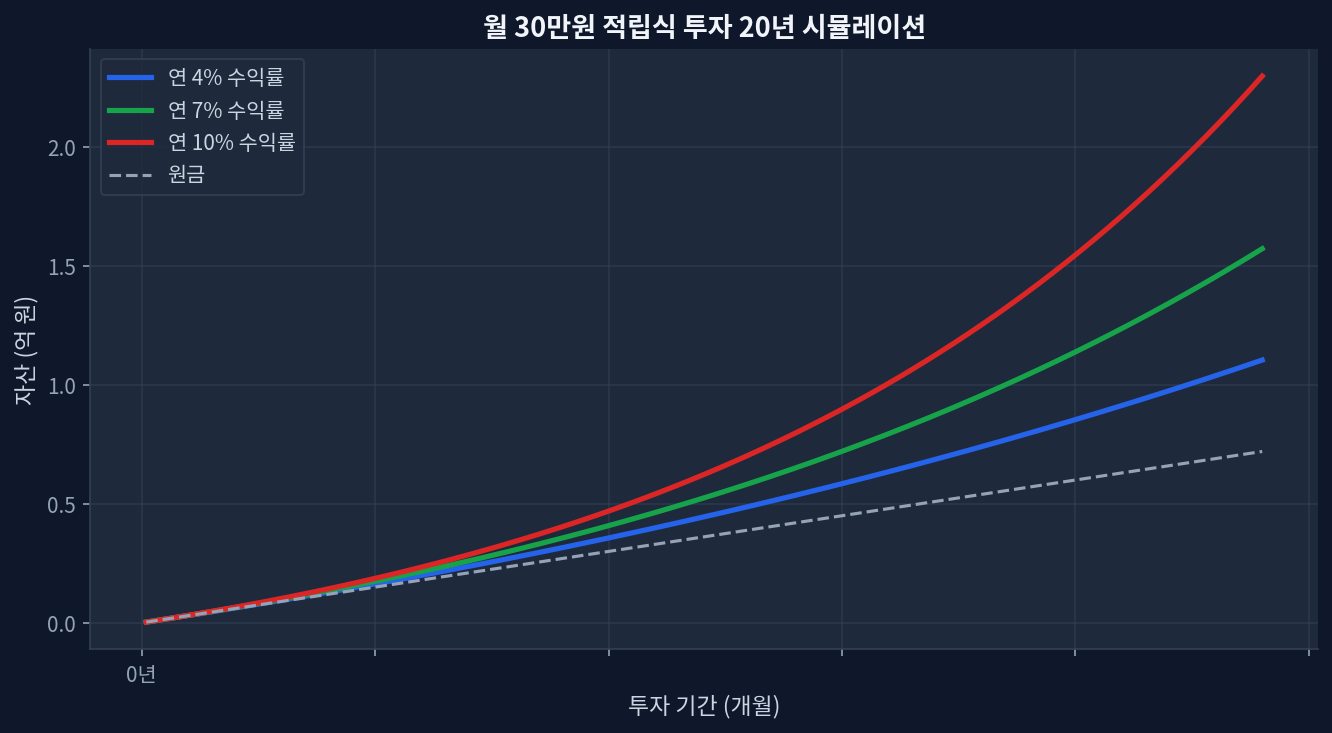
SCHD Dividend Cut of -2.7% Yet Yield Holds at 3.25%: Dividend Stability Through Market Cycles Monthly $30K investment 20-year compound growth simulation SCHD quarterly dividend: $0.2530, down 2.7% year-over-year Dividend yield: Still 3.25% — 2.2x higher than VIG's 1.47% 1-year total return: +26.5% (dividends plus capital appreciation) Current valuation: P/E 18.8, moderate level; trading near 85.7% of 52-week high Assets under management: $94.9B — scale supporting dividend stability The Dividend Cut That Does Not Signal Weakness 20-year monthly investment accumulation with dividend reinvestment Schwab US Dividend Equity ETF (SCHD) announced its quarterly dividend at $0.2530, representing a 2.7% decrease versus the same quarter in 2024 when it paid $0.2600. On its surface, this reads negative—dividends were reduced, after all. ...

June 30, 2026 · InvestIQs Research
SCHD Quarterly Dividend Cut 2.7%: Why the 3.25% Yield Persists | SCHD

SCHD Quarterly Dividend Cut 2.7%: Why the 3.25% Yield Persists | SCHD

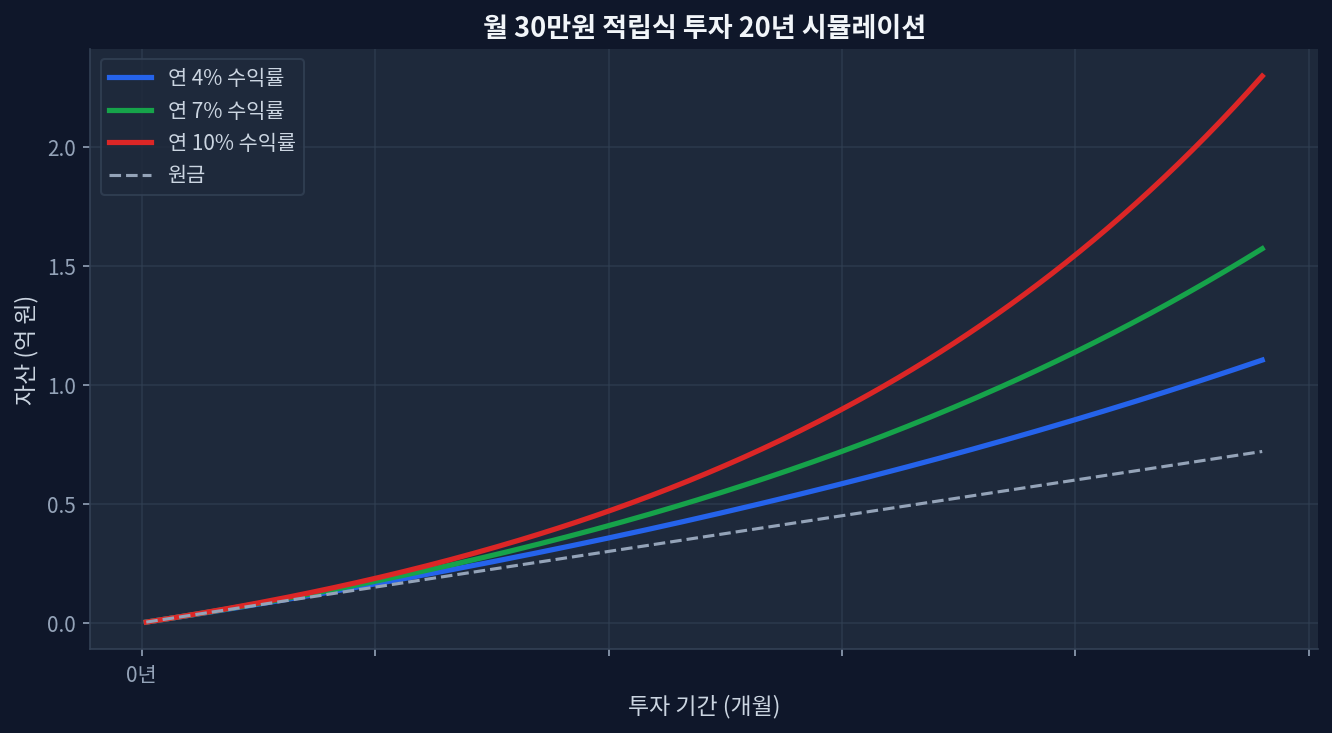
SCHD Quarterly Dividend Cut 2.7%: How the 3.25% Yield Remains Intact schd/compound-growth.png" alt="Monthly $30K investment 20-year compound growth simulation" loading="lazy" style="max-width:100%;border-radius:8px;">Monthly $30K investment 20-year compound growth simulation SCHD quarterly dividend: $0.2530 down 2.7% from prior year Dividend yield: 3.25% maintained — 2.2x higher than VIG's 1.47% One-year return: +26.5% (dividends plus price appreciation) Current valuation: P/E 18.8 at moderate levels, near 85.7% of 52-week high Assets under management: $94.9B underpinning dividend stability Dividend Cut, Yet Far From Weak Dollar-cost averaging simulation over 20-year period Schwab US Dividend Equity ETF (SCHD) announced its quarterly dividend at $0.2530. This marks a 2.7% decrease from the same quarter in 2024 at $0.2600. On the surface, negative territory. The dividend was cut, after all. ...

June 29, 2026 · InvestIQs Research
SCHD Cuts Quarterly Dividend 2.7% Yet Holds 3.25% Yield: What the Numb

SCHD Cuts Quarterly Dividend 2.7% Yet Holds 3.25% Yield: What the Numb

SCHD quarterly dividend: $0.2530, down 2.7% year-over-year Dividend yield: 3.25% — 2.2× higher than VIG's 1.47% 1-year total return: +26.5% (dividends + price appreciation) Current valuation: P/E 18.8 (moderate), near 52-week high at 85.7% AUM: $94.9B — asset base supports dividend stability Dividend Cut, Yet No Signal of Distress Monthly $30K investment 20-year compound growth simulation Schwab US Dividend Equity ETF (SCHD) announced a quarterly dividend of $0.2530. This represents a 2.7% decline versus the same quarter in 2024, which paid $0.2600 [Schwab]. On the surface, this reads negative—a dividend reduction. ...

June 28, 2026 · InvestIQs Research
SCHD vs High-Growth Dividend ETFs: Tax Efficiency Strategy for 3% Yields

SCHD vs High-Growth Dividend ETFs: Tax Efficiency Strategy for 3% Yields

SCHD yield: 3.25% vs VIG 1.47% — 78bp spread reflects dividend-focused mandate vs growth tiltVIG outperformed on 3Y total return: +55.7% vs SCHD +47.6% (800bp gap), but tax burden differs sharply in taxable accountsSCHD P/E 18.8 vs VIG 26.2 — SCHD trades at 28% discount; suggests lower valuation risk but higher dividend cut exposure in recessionTax location matters most: Roth IRA locks in tax-free compounding; traditional 401(k) defers gains; taxable brokerage faces annual 1099-DIV liability on qualified dividends52-week positioning: SCHD at 84.3% of range (near highs), VIG at 92.7% — timing risk elevated for lump-sum purchases The Tax-Efficiency Angle: Why Yield Location Determines Real Returns Monthly $30K investment 20-year compound growth simulation Most dividend ETF comparisons focus on gross yield and total return. They miss the tax dimension entirely. A 3.25% yield in a taxable brokerage account becomes 2.35% after federal qualified dividend tax (assuming 28% top rate), but that same yield in a Roth IRA stays 3.25% forever, compounding untaxed. SCHD’s higher dividend distribution creates this tax burden front-and-center, while VIG’s lower yield (1.47%) means lighter annual 1099-DIV reporting but higher embedded capital gains. ...

June 22, 2026 · InvestIQs Research
VYM Quarterly Dividend Increase to $0.98 — Reassessing Tax-Efficient D

VYM Quarterly Dividend Increase to $0.98 — Reassessing Tax-Efficient D

VYM announces quarterly dividend of $0.98 — a 13.7% increase year-over-yearNew dividend yield approximately 2.48% (yfinance currently reflects 2.21%, will update post-announcement)After qualified dividend taxes (15% federal rate for most investors), net yield drops to 2.10%5-year cumulative total return of +72.5% outpaces SCHD (+48.4%), with price appreciation driving most gainsTax-deferred accounts like traditional IRAs can shelter dividend income entirely, preserving the full 2.48% yield VYM Dividend Increase: Reading the Numbers Monthly $30K investment 20-year compound growth simulation 20-year compound growth simulation: monthly 500-dollar investment Vanguard High Dividend Yield ETF (VYM) announced a quarterly dividend of $0.98 per share for the current period, representing a 13.7% increase from the previous quarter. In absolute terms, that translates to a $0.1346 per-share increase. The prior quarterly dividend was approximately $0.8620, and with the new distribution, the annualized dividend yield climbs to $3.92 from the previous $3.45 estimate. ...

June 20, 2026 · InvestIQs Research

JEPI Dividend Calculator — Dividend Reinvestment Simulation

See JEPI’s dividends in numbers JEPI (JPMorgan Equity Premium Income ETF) generates income by combining a low-volatility U.S. equity portfolio with an options-overlay (equity-linked notes). The result is a high distribution and smoother ride, but capped upside in strong rallies. ...

June 14, 2026 · InvestIQs Editorial

JEPI vs JEPQ — ETF Comparison

JEPI vs JEPQ: Key Differences JEPI and JEPQ share the same JPMorgan equity-premium-income strategy but differ in their equity base. JEPI uses a low-volatility U.S. stock portfolio; JEPQ applies the same overlay to Nasdaq-100-style holdings. ...

June 14, 2026 · InvestIQs Editorial

JEPQ Dividend Calculator — Dividend Reinvestment Simulation

See JEPQ’s dividends in numbers JEPQ (JPMorgan Nasdaq Equity Premium Income ETF) applies the same equity-premium-income approach as JEPI, but on a Nasdaq-100-style portfolio. Higher growth exposure means higher yield and higher volatility. ...

June 14, 2026 · InvestIQs Editorial