TIGER S&P500 ETF vs US Alternatives: Tax & Diversification Dynamics

TIGER S&P500 ETF vs US Alternatives: Tax & Diversification Dynamics

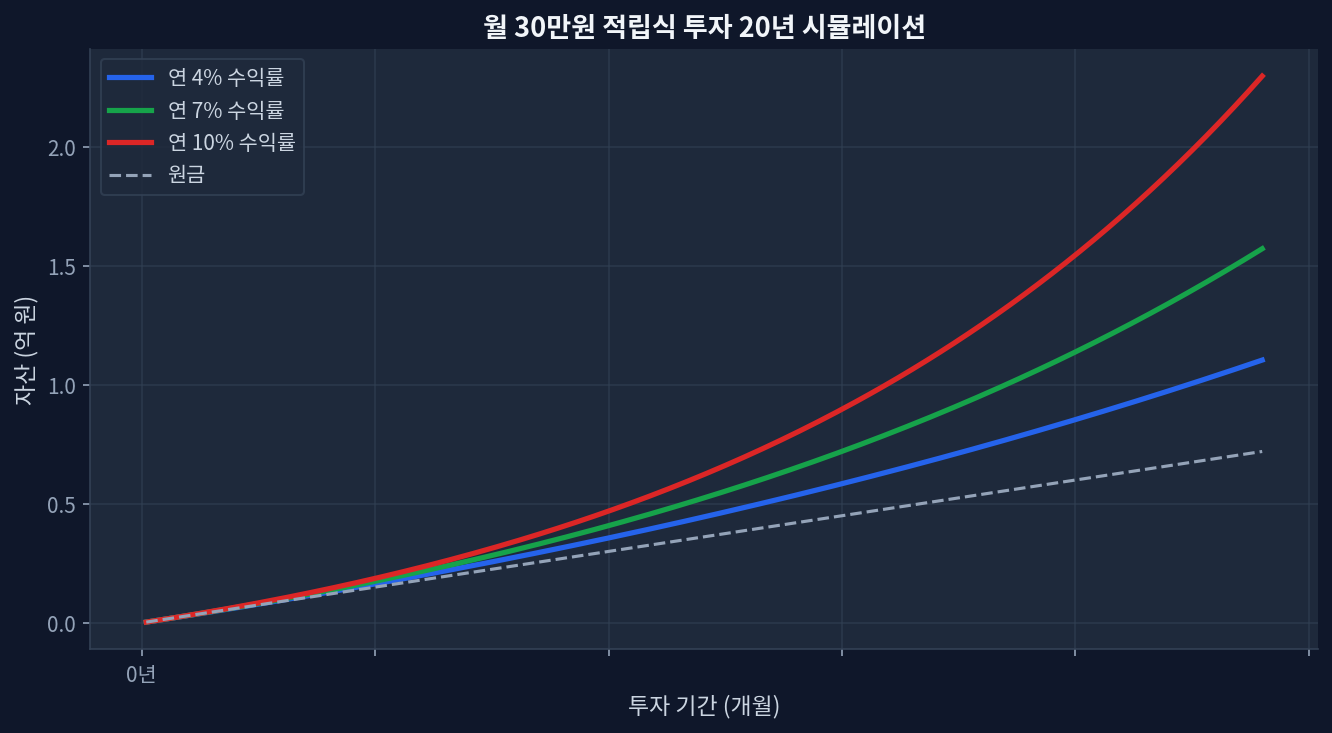
TIGER tracked +86.0% over 5 years (2020–2026), matching US-listed VOO's performance but with Korean tax and currency considerationsschd-which-etf-wins-under-a-15-capital-gains-tax-regime/">VOO yields 1.03% at 26.2× P/E; SCHD yields 3.25% at 18.9× P/E—representing core-growth versus income-focused positioningKorea's 22% capital gains tax versus US 15–20% rates creates different tax-optimization strategies, not fund-specific savingsGeographic diversification through TIGER makes sense for global investors managing multiple accounts; US-based investors typically prefer VOO's liquidityTax efficiency depends more on account structure (tax-deferred vs. taxable) and holding discipline than ETF choice itselfWhy Global Investors Consider TIGER (And Why It Rarely Makes Sense for US Residents) Monthly $30K investment 20-year compound growth simulation TIGER 미국S&P500 is a Korean-domiciled ETF tracking the S&P500, available primarily through Korean brokers and some international platforms like Interactive Brokers. For investors outside the US or managing Korean-based capital, TIGER provides familiar tax reporting and avoids certain cross-border withholding complexities. For US tax residents, the picture inverts: direct ownership of VOO ($670.26, $1.7 trillion AUM) offers superior liquidity, lower fees (0.03%), and simpler tax treatment under IRC statutes. ...
June 28, 2026 · InvestIQs Research
VOO vs SCHD: Which ETF Wins Under a 15% Capital-Gains Tax Regime?

VOO vs SCHD: Which ETF Wins Under a 15% Capital-Gains Tax Regime?

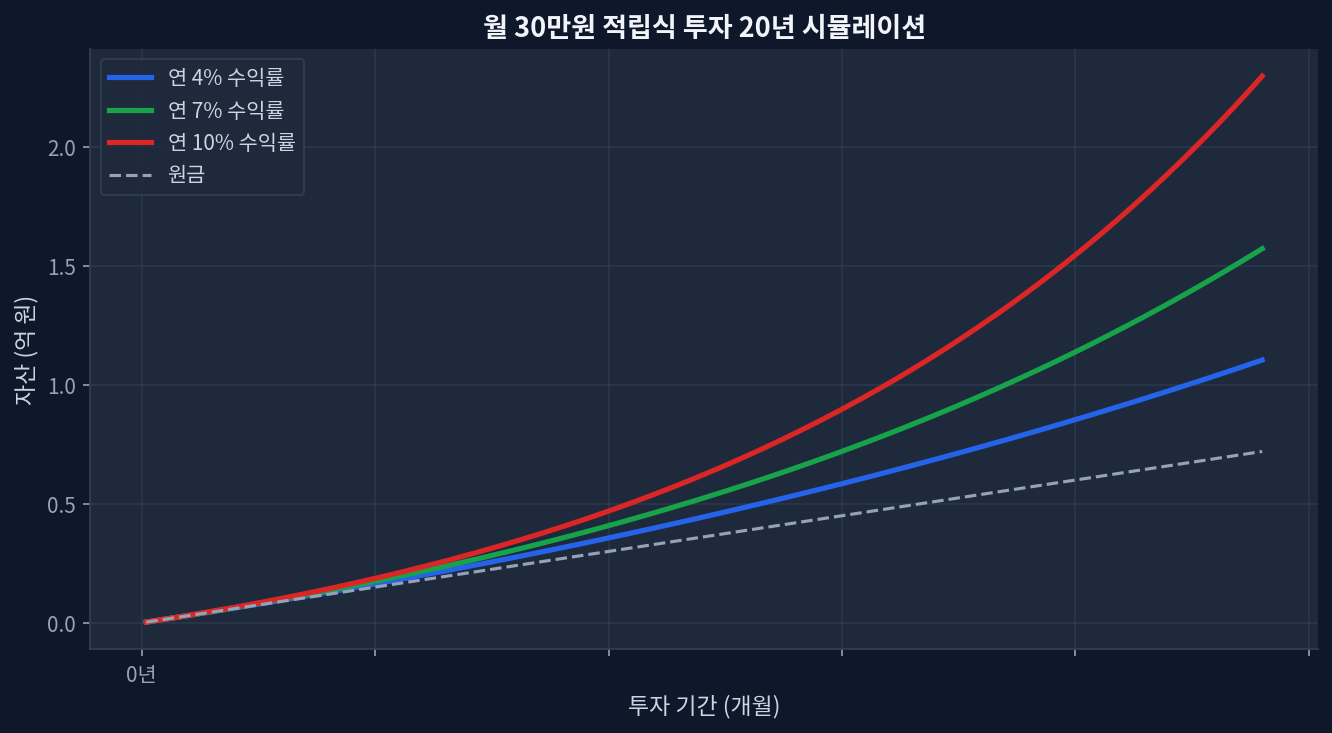
VOO delivered +26.8% return YTD with 1.03% yield; compounding-beats-2m-krw-in-annual-savings/">SCHD posted +24.2% with 3.25% yield 5-year divergence: VOO +89.0% vs SCHD +48.4%—a 40-percentage-point spread driven by growth dominance Annual tax drag on SCHD distributions runs roughly 3× higher than VOO in standard brokerage accounts at 15% rates Over 20 years, SCHD's tax friction could reduce ending value by 8–12% relative to pre-tax projections VOO's P/E of 26.9 vs SCHD's 18.8 signals growth premium; contrarian case favors SCHD if rates compress Two Philosophies, One Tax Problem Monthly $30K investment 20-year compound growth simulation VOO, the Vanguard S&P 500 ETF, tracks all 500 large-cap stocks with an expense ratio of 0.03% and minimal annual distributions (1.03% yield). SCHD, Schwab U.S. Dividend Equity ETF, targets dividend-growth stocks at 0.06% expense and generates 3.25% annual income. Performance over the past year shows VOO ahead: +26.8% versus SCHD’s +24.2%. Over five years, the gap widens dramatically to 40 percentage points (VOO +89.0%, SCHD +48.4%)[Yahoo Finance]. ...

June 20, 2026 · InvestIQs Research
Tax-Optimized SPY Growth: Building $500K Over 20 Years

Tax-Optimized SPY Growth: Building $500K Over 20 Years

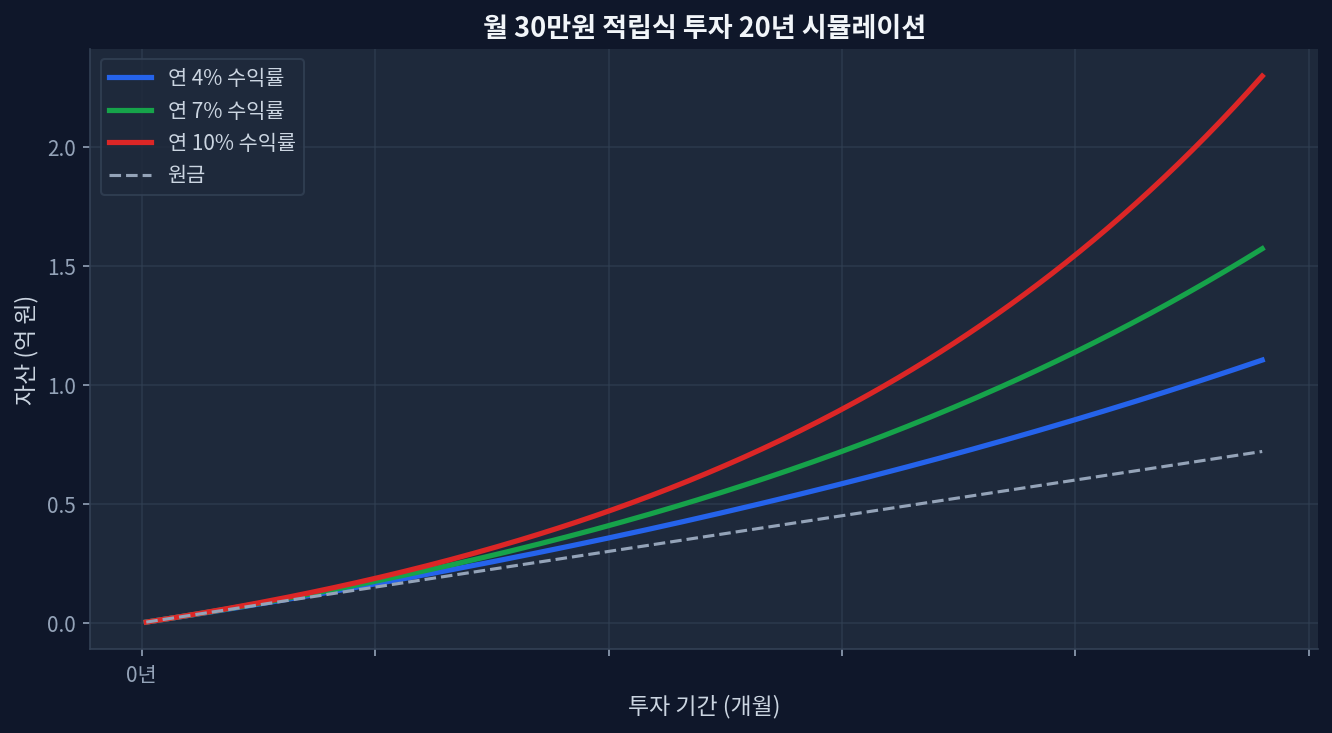
Key Takeaways$500/month SPY investment reaches $495K–$560K after 20 years (7–10% annual returns, depending on tax scenario)Tax-advantaged accounts compound ~$100K–$150K more wealth than taxable accounts due to deferred or eliminated taxesDividend tax drag: SPY's 1.0% yield generates ~$7,400 in taxable income annually in year 20 (if held in taxable brokerage)Long-term capital gains rate: 15–20% federal (depending on income bracket), plus 0–13% state taxValuation risk: SPY's P/E of 26.5 is historically elevated; 5–8% returns more realistic than past decade's 25%+ returns Why Tax Strategy Trumps Fund Selection in Long-Term Wealth Building Monthly $30K investment 20-year compound growth simulation Most investors focus on beating the market or picking the right fund. They miss a bigger opportunity: minimizing taxes. Consider this: a portfolio growing at 9% annually in a taxable account effectively grows at 6.5–7% after taxes (assuming 25% blended tax rate on dividends and capital gains). The same portfolio in a Roth IRA grows at the full 9% tax-free. ...

June 18, 2026 · InvestIQs Research
Data-Driven Analysis of Tax-Gain Harvesting: Utilizing the 0% LTCG Bracket for US ETFs

Data-Driven Analysis of Tax-Gain Harvesting: Utilizing the 0% LTCG Bracket for US ETFs

Empirical analysis of tax-gain harvesting utilizing the 0% Long-Term Capital Gains (LTCG) tax bracket to step up cost basis in taxable accounts.Systematically realizing capital gains up to the federal threshold demonstrates a measurable increase in the portfolio's net-of-tax Compound Annual Growth Rate (CAGR) over a 10-year modeling period.Strategic execution—balancing bid-ask spreads, intraday volatility, and zero-wash-sale penalties for gains—remains the critical variable for maintaining underlying market exposure. The Tax Dilemma: Tax-Advantaged Accounts vs. Taxable Brokerages Monthly $30K investment 20-year compound growth simulation Roth IRA, Traditional IRA, and Taxable Brokerage Tax Efficiency Comparison Evaluating tax-advantaged account performance reveals that the structural elimination of tax drag produces substantial alpha over decadal timelines. Within Roth IRAs or 401(k)s, dividends and capital gains compound without immediate federal tax friction. Conversely, operating a primary US ETF portfolio within a standard taxable brokerage account introduces a severe constraint: the 15% or 20% capital gains tax rate upon liquidation. When a portfolio compounds over a decade, unrealized gains grow exponentially. Liquidating a highly appreciated asset block during retirement triggers immediate and punitive tax liabilities, severely compressing the realized CAGR. [IRS Capital Gains Tax Guide] ...

May 24, 2026 · InvestIQs Research
Roth IRA vs Traditional IRA: 5-Scenario Capital Gains Tax Decomposition

Roth IRA vs Traditional IRA: 5-Scenario Capital Gains Tax Decomposition

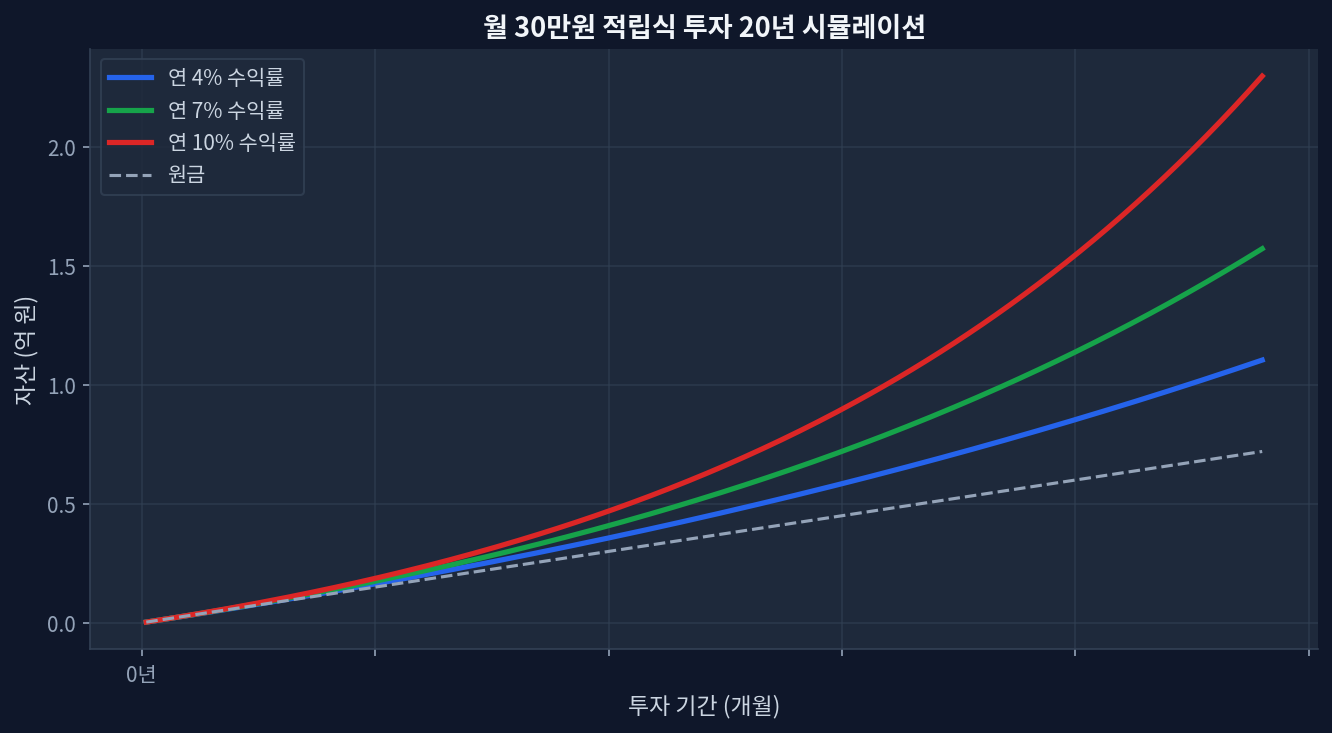
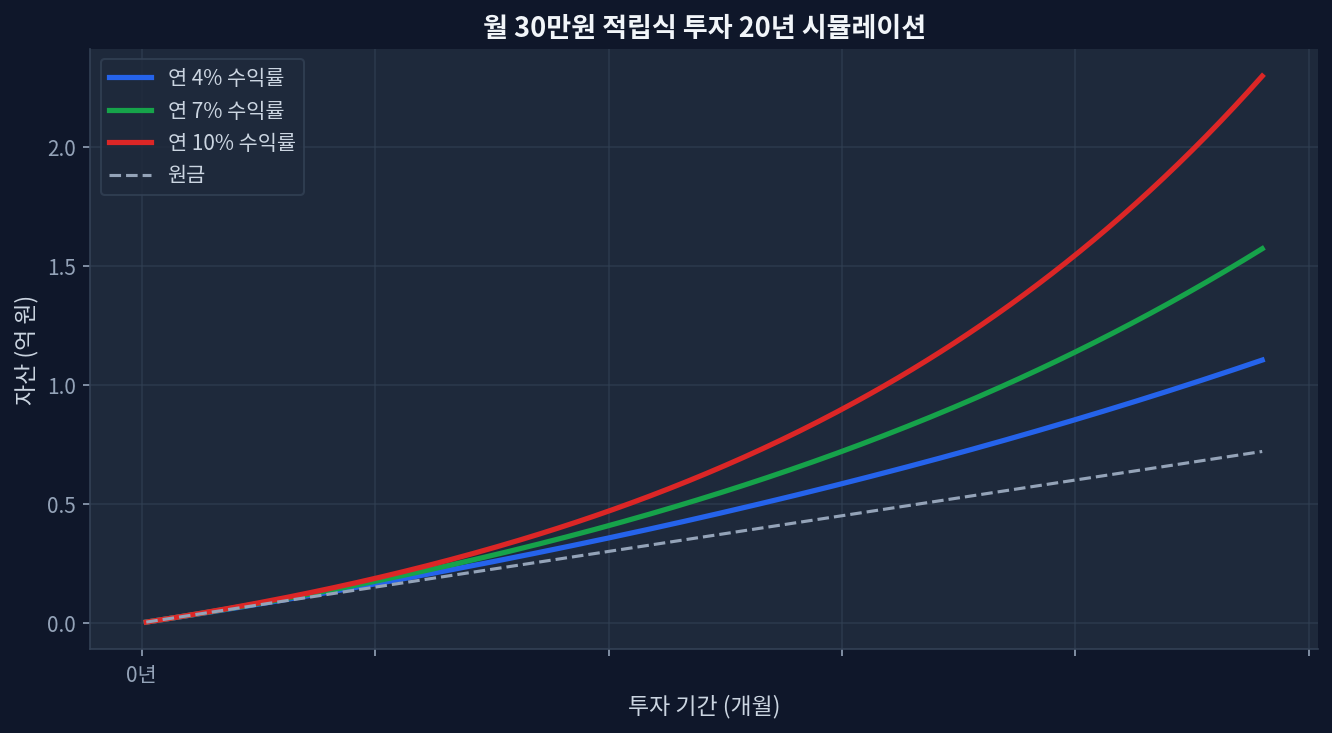
Upfront tax on Roth IRA contributions acts as a drag during prolonged market drawdowns, altering the break-even horizon. Traditional IRA deductions reinvested into taxable accounts can outperform Roth in bracket-compression scenarios. Asset location—placing VTI in Roth and BND in Traditional—adds approximately 40-60 bps of tax alpha annually. The 2020-2026 CAGR of US equities heavily skewed recent analyses toward Roth, hiding sequence-of-returns risks. The Core Mechanics of IRA Taxation Monthly $30K investment 20-year compound growth simulation The chart below shows a 20-year simulation of a $300 monthly investment (4%, 7%, and 10% annually). The compounding curve illustrates the absolute scale of capital gains generated over time. Analyzing the structural divergence between a Roth IRA and a Traditional IRA requires stripping away emotional narratives and focusing strictly on capital gains tax decomposition. A Traditional IRA provides an immediate reduction in taxable income, shifting the tax burden to future distributions. Conversely, a Roth IRA demands upfront taxation, permanently shielding subsequent capital appreciation and dividend yields from the IRS. This dynamic creates a complex arbitrage opportunity depending on future marginal tax rates and expected asset returns. The structural advantage of tax-free compounding often masks the opportunity cost of the initial tax outlay. [IRS.gov] ...

May 18, 2026 · InvestIQs Research