Maximizing Yield Through 2022 Drawdown Recovery Speed Analysis: VOO, BND, TLT, GLD
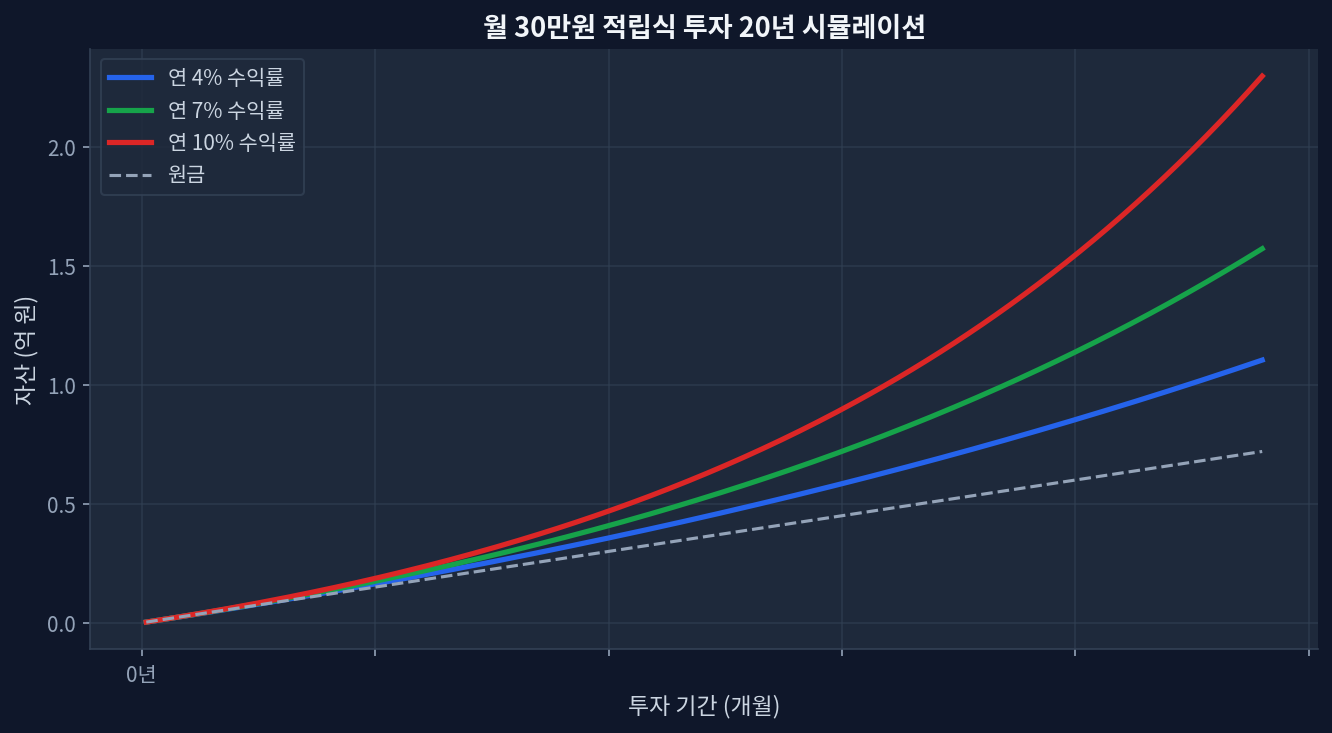
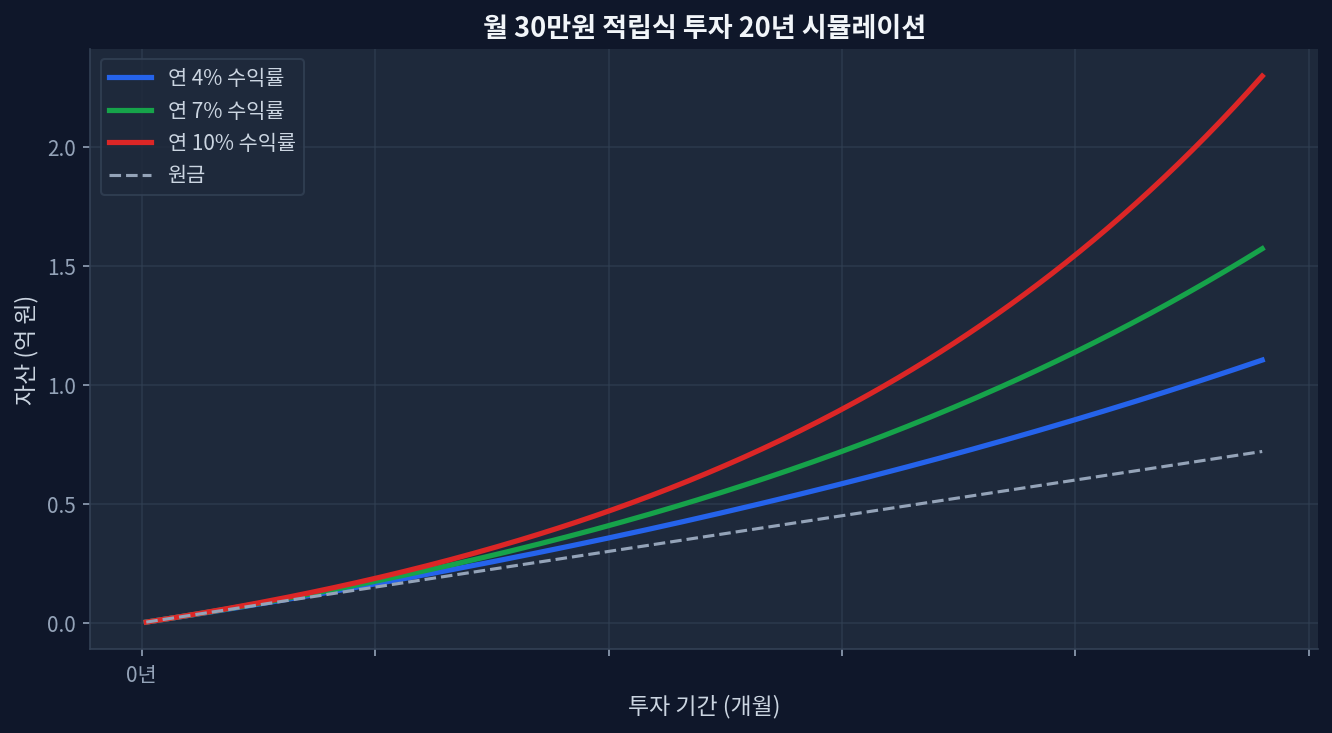
TLT continues to struggle with a 5-year return of -27.3% and a 3-year return of -7.2%, despite offering a 4.57% dividend yield.BND shows resilience with a +5.5% 1-year return and a +11.3% 3-year return, yielding 3.93%.GLD exhibits explosive growth, trading at $416.99 with a massive +138.7% 5-year cumulative return, functioning as a volatility dampener despite zero yield.Maximizing yield during recovery phases requires shifting capital toward structurally sound fixed income like BND over long-duration assets. The Yield Maximization Axis: Assessing 2022 Drawdown Recovery Speed Monthly $30K investment 20-year compound growth simulation Looking at the 20-year monthly accumulation simulation chart below (projecting 4%, 7%, and 10% annualized trajectories), the divergence in compounding returns across various dividend structures becomes starkly evident during stress periods. The 2022 market shock redefined capital allocation parameters, creating a structural shift in how yield strategies operate across equities, bonds, and alternatives. Real-time data exposes the persistent lag in long-duration Treasuries. TLT currently trades at $84.22 with a 1-year return of +4.9%, yet the 5-year cumulative return remains severely compressed at -27.3%[Yahoo Finance]. Conversely, intermediate bonds have re-established stability. BND recorded a 1-year return of +5.5% and a robust +11.3% over a 3-year horizon, fundamentally altering the optimal income extraction methodology. ...